
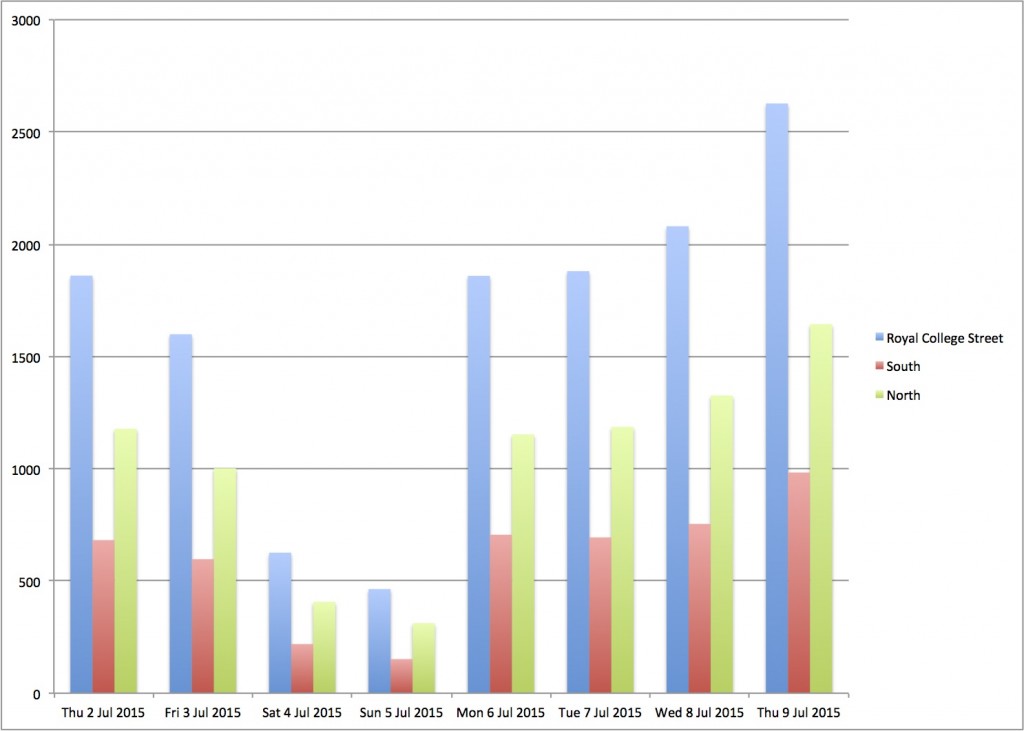
Update: On Thu 9 July a record 2627 people used the Royal College Street cycle tracks to avoid the tube strike
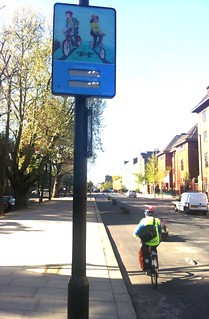
The Cycle Counter was installed in Royal College Street in mid April 2014. Data is collected by one loop on the southbound track and another on the northbound track. The display shows us the total figures for the day (northbound + southbound) and the sum of the daily totals for the last year. All of the counts have been saved on the supplier’s server at intervals of one hour, allowing subsequent analysis to be done. This report describes a few statistics and attempts to identify some trends shown in the first year’s data from 1st May 2014 to 30th April 2015.
Camden Council agreed to install the counter following requests from Camden Cyclists. They seem to agree with us that it is a very useful source for data because they say they plan to install others on new routes for example the Royal College Street southern extension on Pancras Road.
In this report we attempt to give an overview of the data available (expressed yearly, monthly, daily and hourly) together with a simple analysis of the peaks, troughs, averages and so forth. We have done little to correlate the characteristics of the data with external events such as weather, half terms, strikes and so forth.
Yearly totals
For the twelve months from 1st May 2014 to 30th April 2015 the total number of cyclists comes to 440,849 with the number of northbound cyclists being almost twice the number going southbound (about 64% of the total). The dominance of northbound cyclists is probably due to the available alternative southbound routes via St Pancras Way and Camden Street. It seems likely that when the RCS northern extension is built, the southbound numbers will increase.
For the record, the total counted from the installation in April 2014 to the end of May 2015 is almost half a million (495,558).
Monthly data shows peaks in July
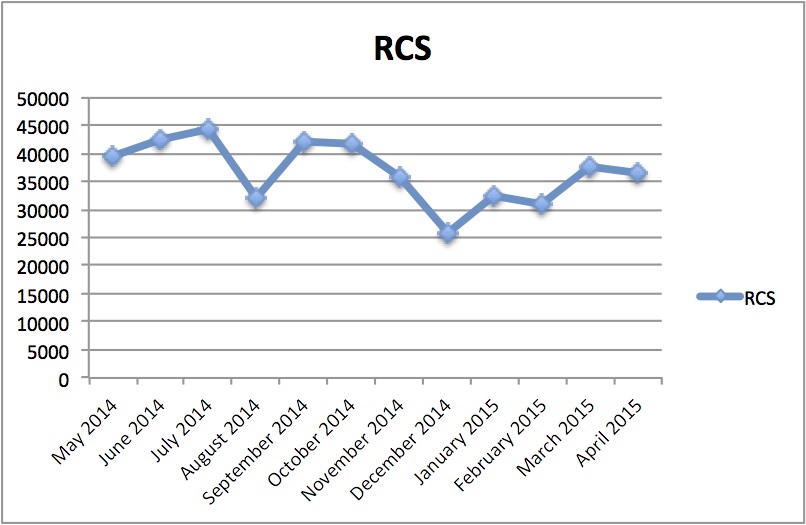
The first chart shows monthly totals during the first year of operation. They start with 39,000 in May, increasing through 42,000 in June to the maximum of 44,000 in July.
August, when people tend to be on holiday, drops to 32,000 but September and October both reach 42,000.
November drops to 36,000 and December, the lowest, to 26,000, then January 2015 rises to 32,000. February drops back to 31,000 then March and April reach 38 and 37,000 respectively.
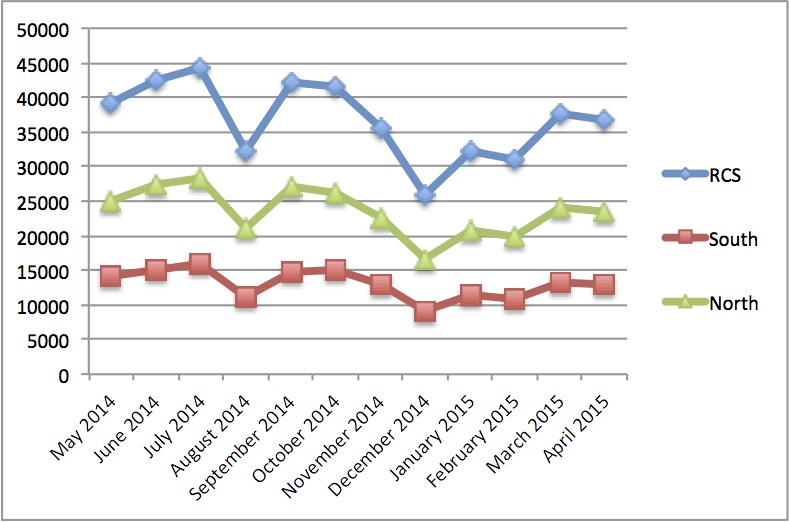
The chart 2 hows the northbound counts in green and the southbound counts in red with the totals in blue. The number of people cycling northbound is almost twice the number going southbound (about 64% of the total).
Weekly data shows peaks at 10,000+
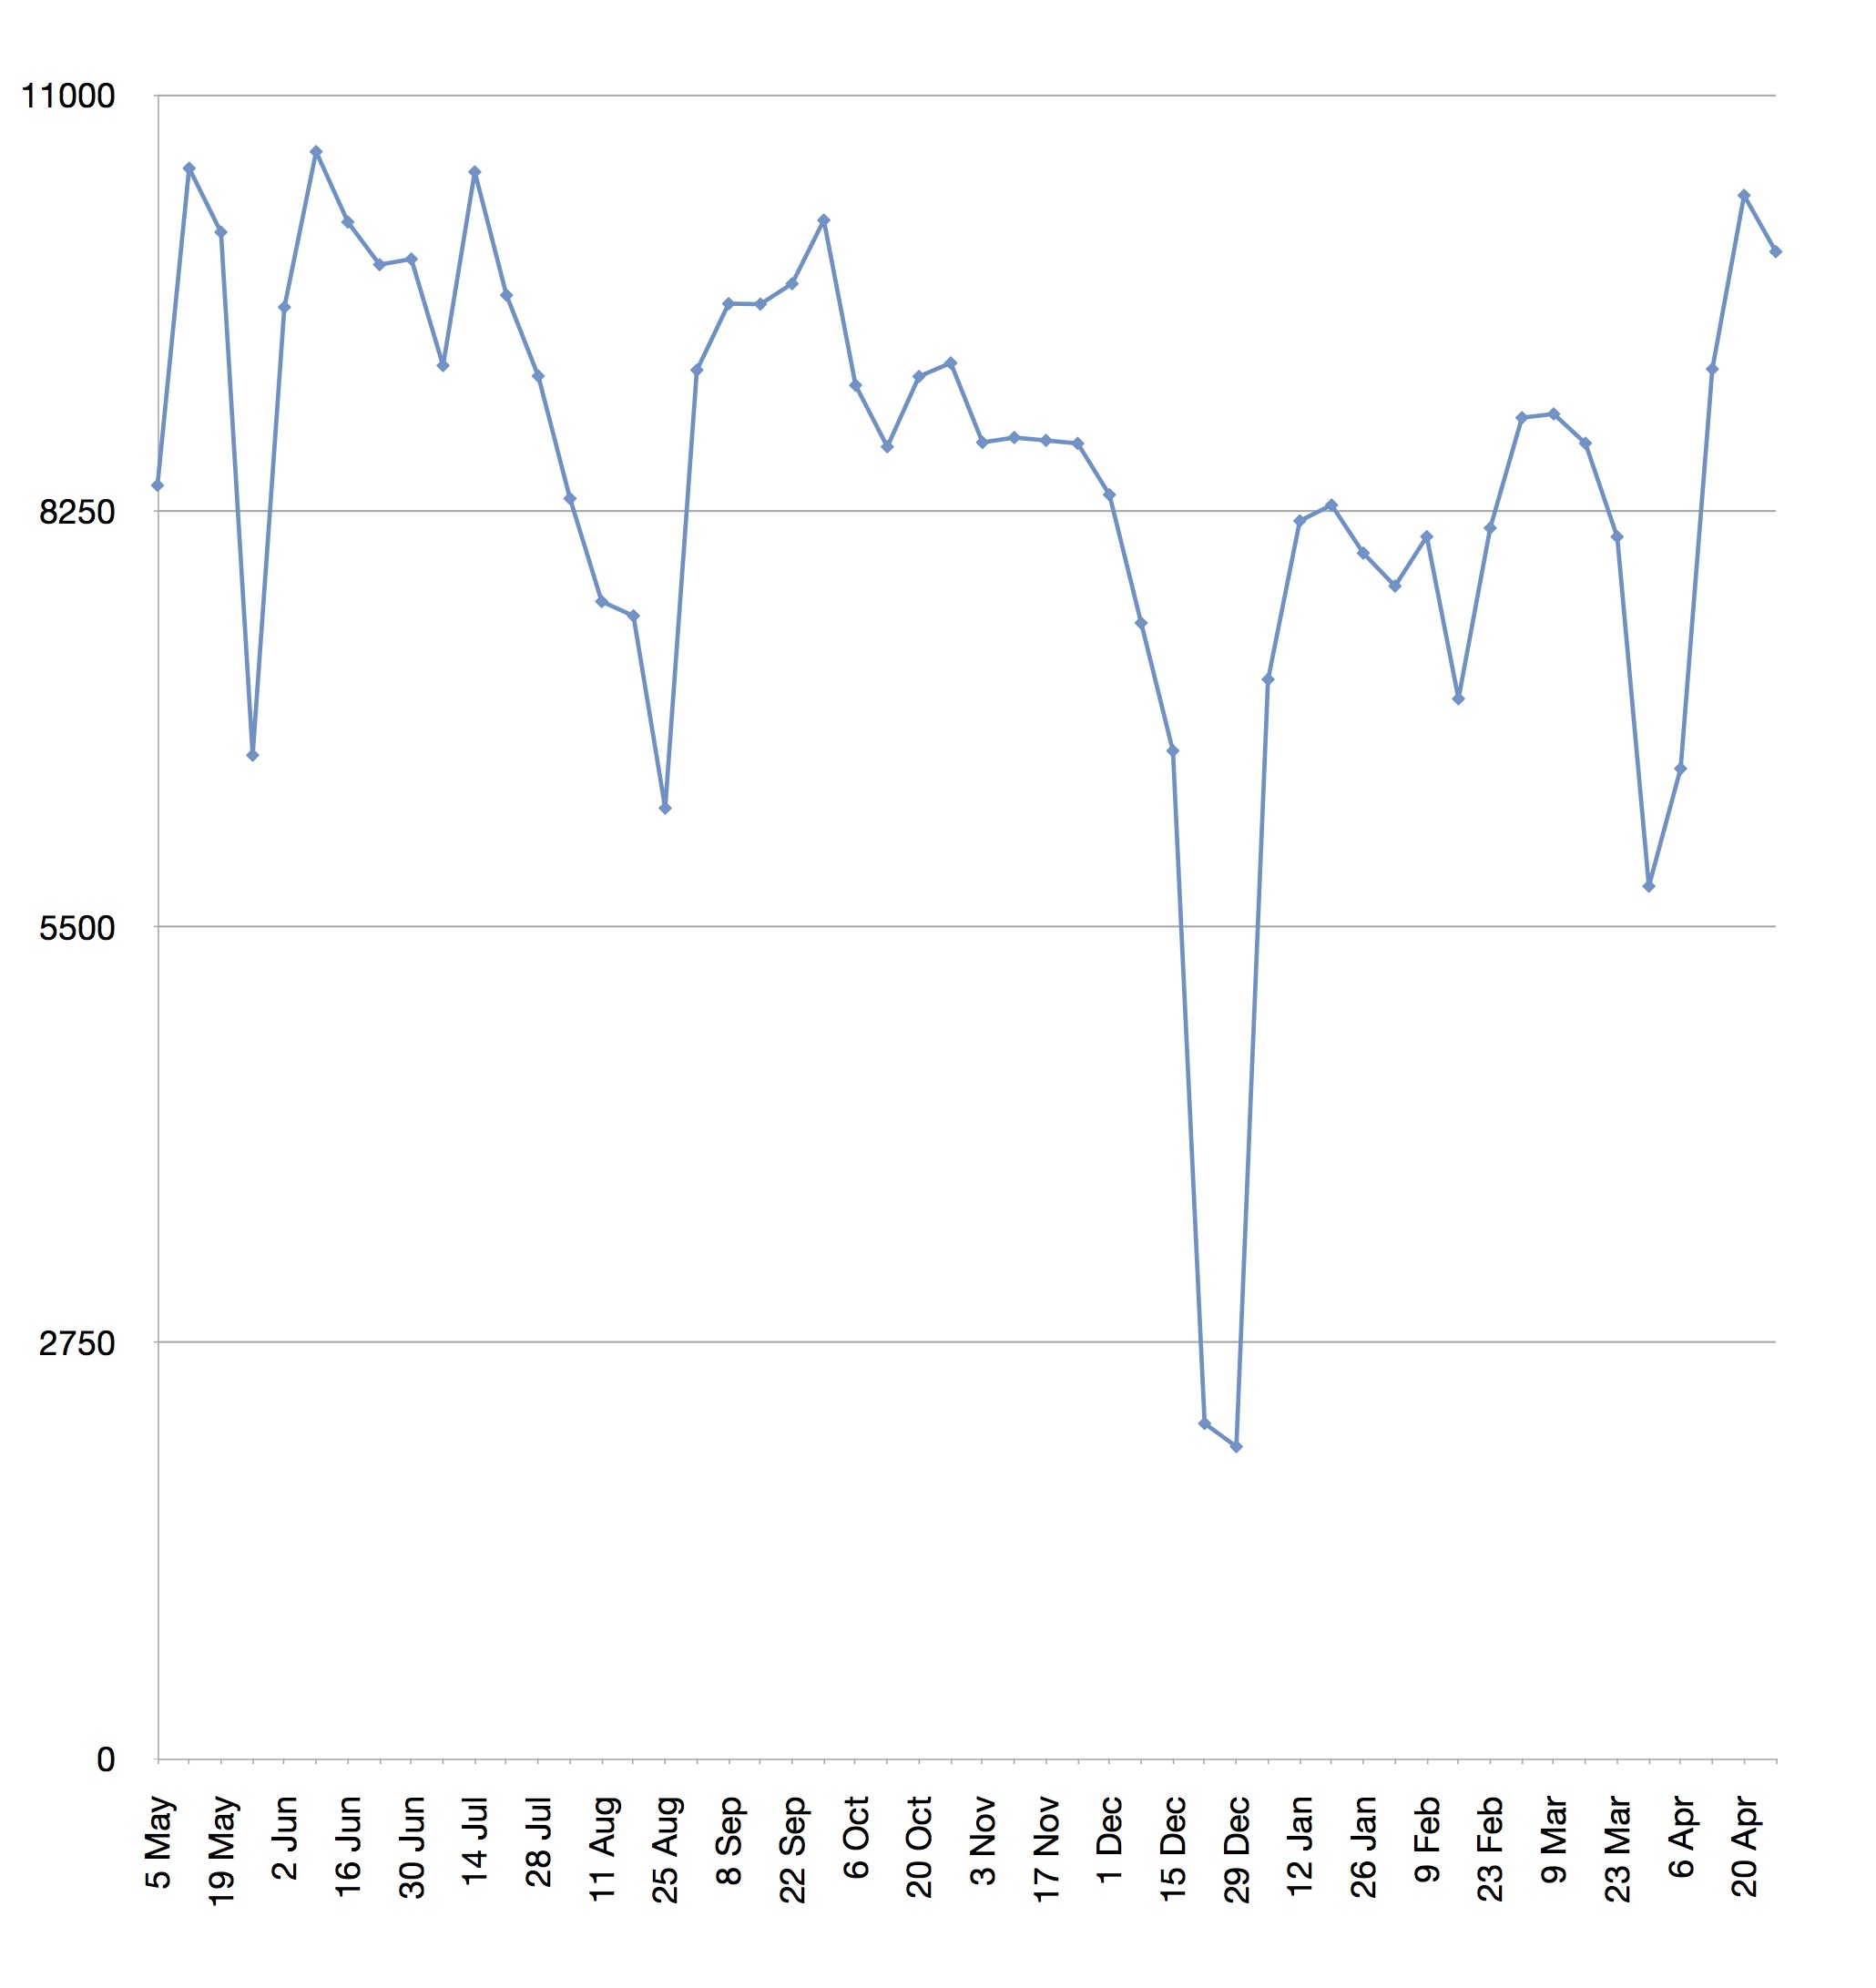
The chart 3 shows the total counts (northbound + southbound) for each week in the yearly period from Monday 5th May 2014 to Monday 26th April 2015. The average weekly count comes to 8445 cycles with 5428 northbound and 3017 southbound.
High counts: The week starting on 9th June 2014 has the highest total of 10,624 but altogether seven weeks have totals over 10,000. The only week in 2015 going over 10,000 cycles is the week starting on 20th April.
Lowest counts: As expected, the two lowest weekly counts (of about 2000) come around Christmas and New Year between 22nd December 2014 and 4th January 2015.
Steady: Apart from the Christmas weeks, only one other week drops below 6000 – starting on 30th March, just before Easter 2015. And only four more are below 7000.
Daily data 1st May 2014 – 30th April 2015
On Tuesday 15th July 2014 the counter recorded the maximum daily total of 2195 cycles with 1349 northbound and 965 southbound. However, the highest recorded day so far was outside our study year; 30th April 2014, when there was a tube strike saw 2,414 cycles. Since there were only nine days in the year when the daily total exceeded 2000, this appears to indicate the existence of people who with some encouragement might become regular cyclists. Most of these highs were on Tuesdays…
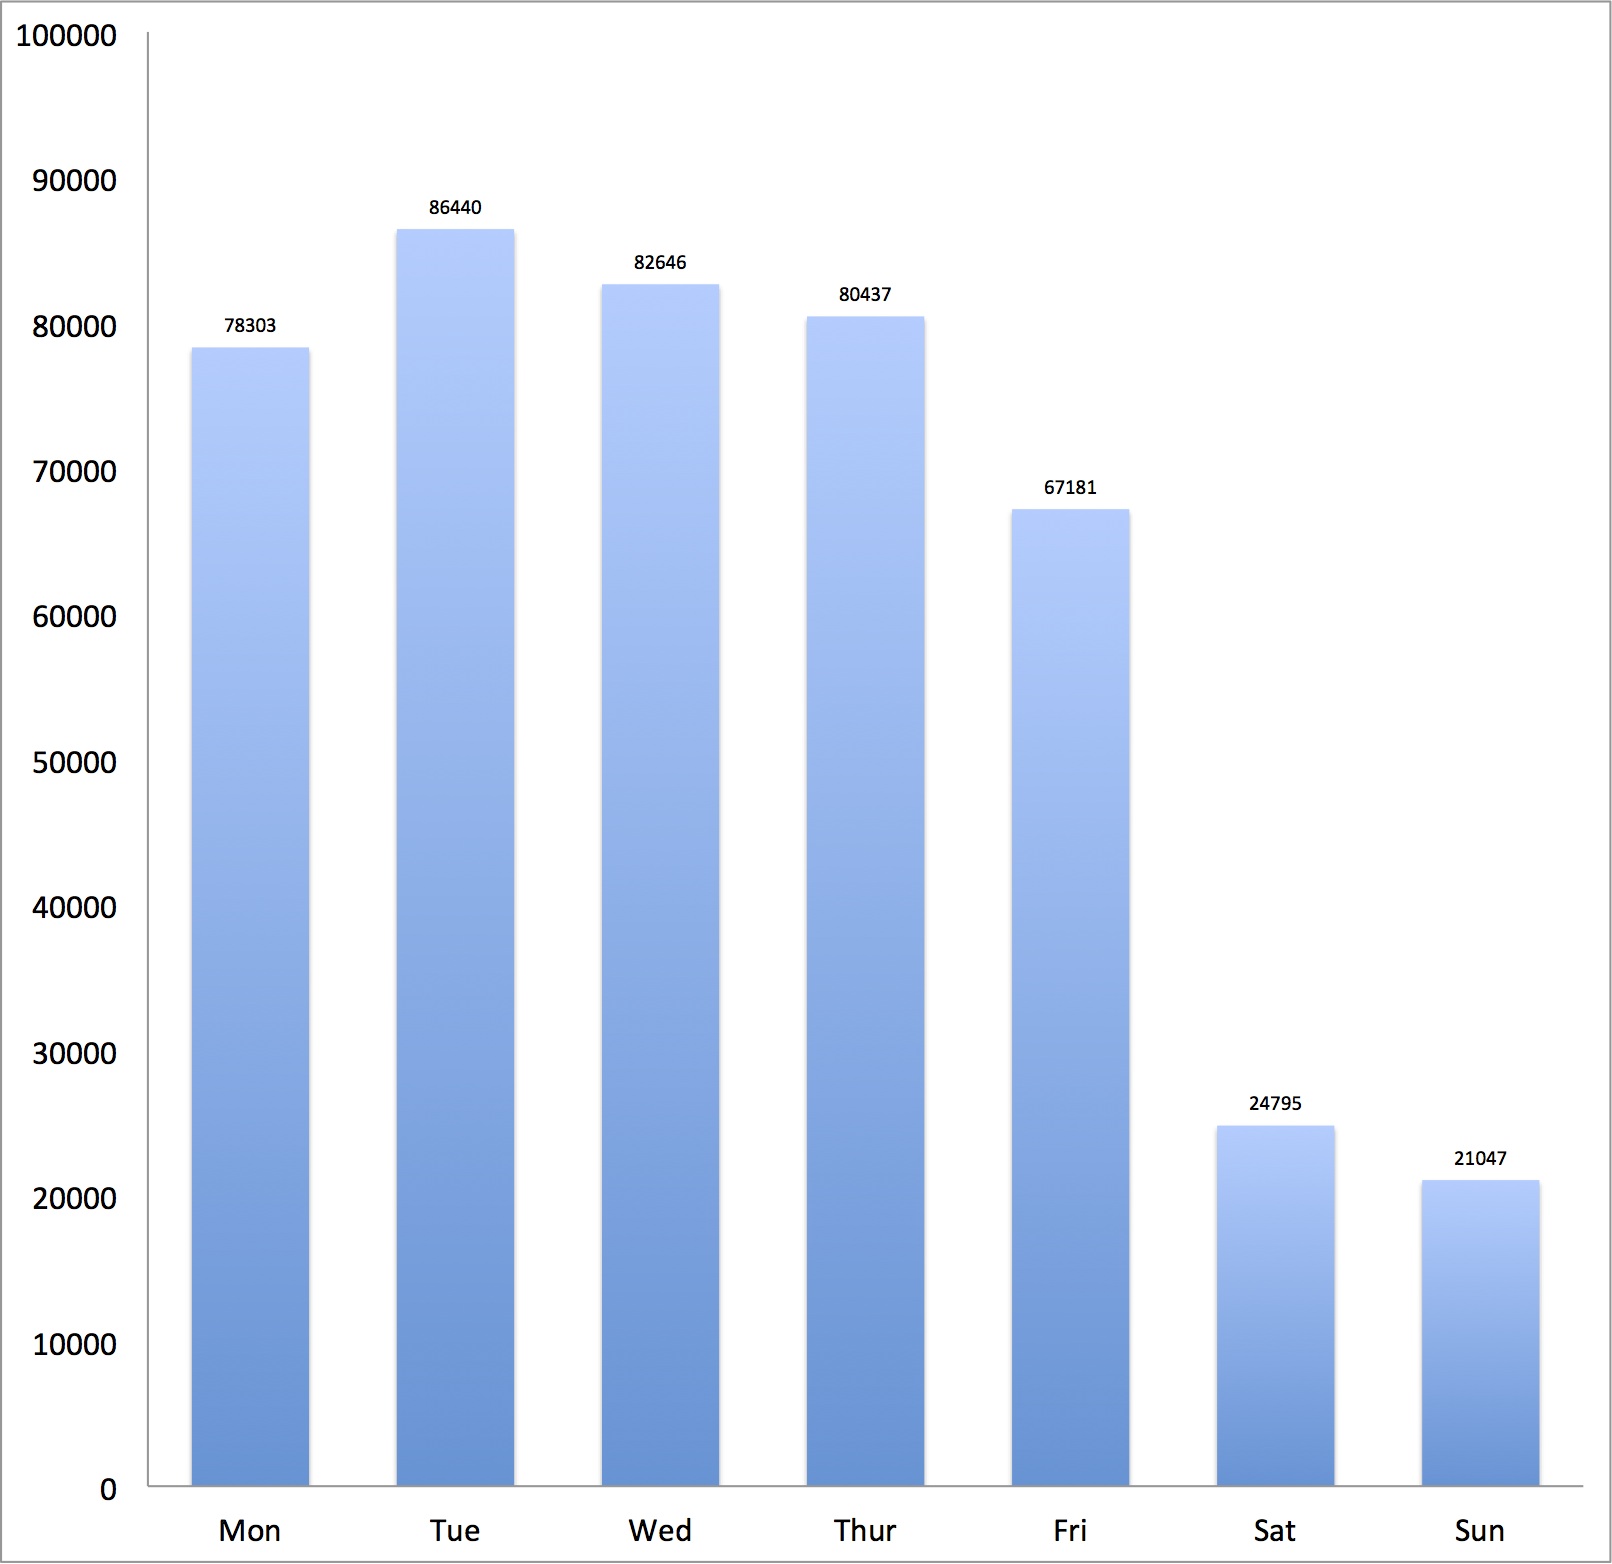
The chart 4 shows the yearly average totals for each day of the week. As expected, the figures for Saturdays and Sundays are considerably lower than for weekdays.
It is interesting to observe that people seem to get going on Mondays and Tuesdays and after that their enthusiasm for cycling seems to decline with fewer on Friday than on Monday. But there could be other factors, for example, their work patterns. On Fridays, perhaps people leave their bikes at home because they are going out after work.
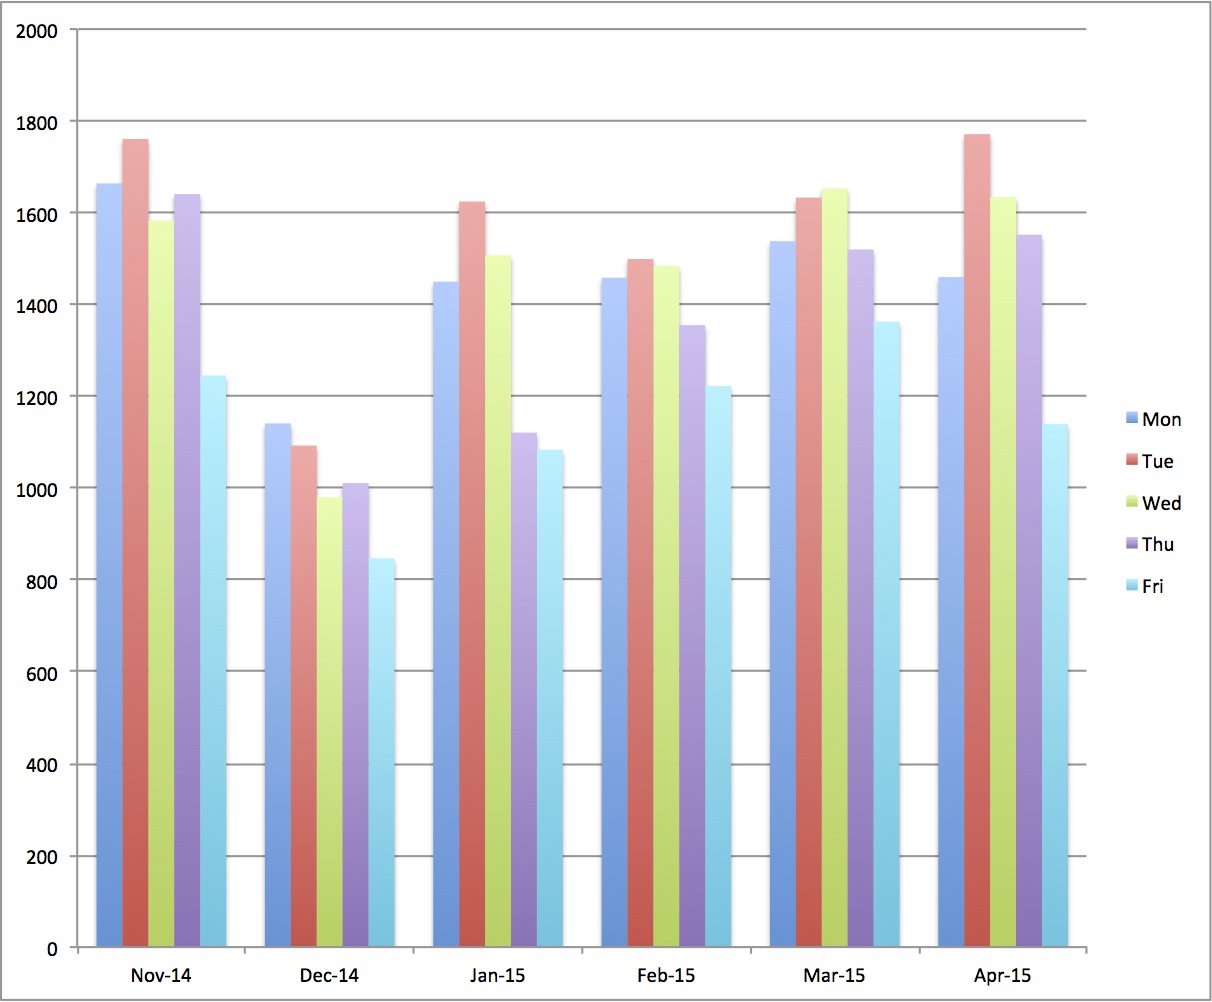
For this reason, we have calculated monthly averages for each weekday to see whether this apparent trend shows when looking at smaller sets of data.
The following two charts (5 and 6) show monthly averages of the totals for each weekday. Eight of these have the maximum on Tuesdays, three on Wednesdays – December (second set in the figure on the right) is different. In most months, the Thursday total is similar to Monday’s and Friday’s is lower.

Hourly Data
The maximum hourly total recorded is 435 cycles on Tuesday 17th July 2014 from 5-6pm with 307 from 6pm-7pm. These numbers are well above what’s shown for peak hours on other days, so this day’s data could be regarded as an outlier and not to be taken seriously as a future target.
The next highest hourly totals are recorded around the date of the Tube strike
| Wed 30 Apr 2014 6pm-7pm | 349 |
| Tue 29 Apr 2014 6pm-7pm | 335 |
| Mon 20 Apr 2015 6pm-7pm | 323 |
| Mon 27 Apr 2015 6pm-7pm | 318 |
These are followed by
| Mon 21 Jul 2014 6pm-7pm | 317 |
| Wed 30 Apr 2014 8am-9am | 315 |
| Mon 22 Sep 2014 6pm-7pm | 313 |
| Tue 15 Jul 2014 6pm-7pm | 307 |
| Mon 28 Apr 2014 6pm-7pm | 301 |
Another 440 hourly slots show totals over 200 cycles per hour. The vast majority of these are in the hour 6pm-7pm with 8-9am following up.
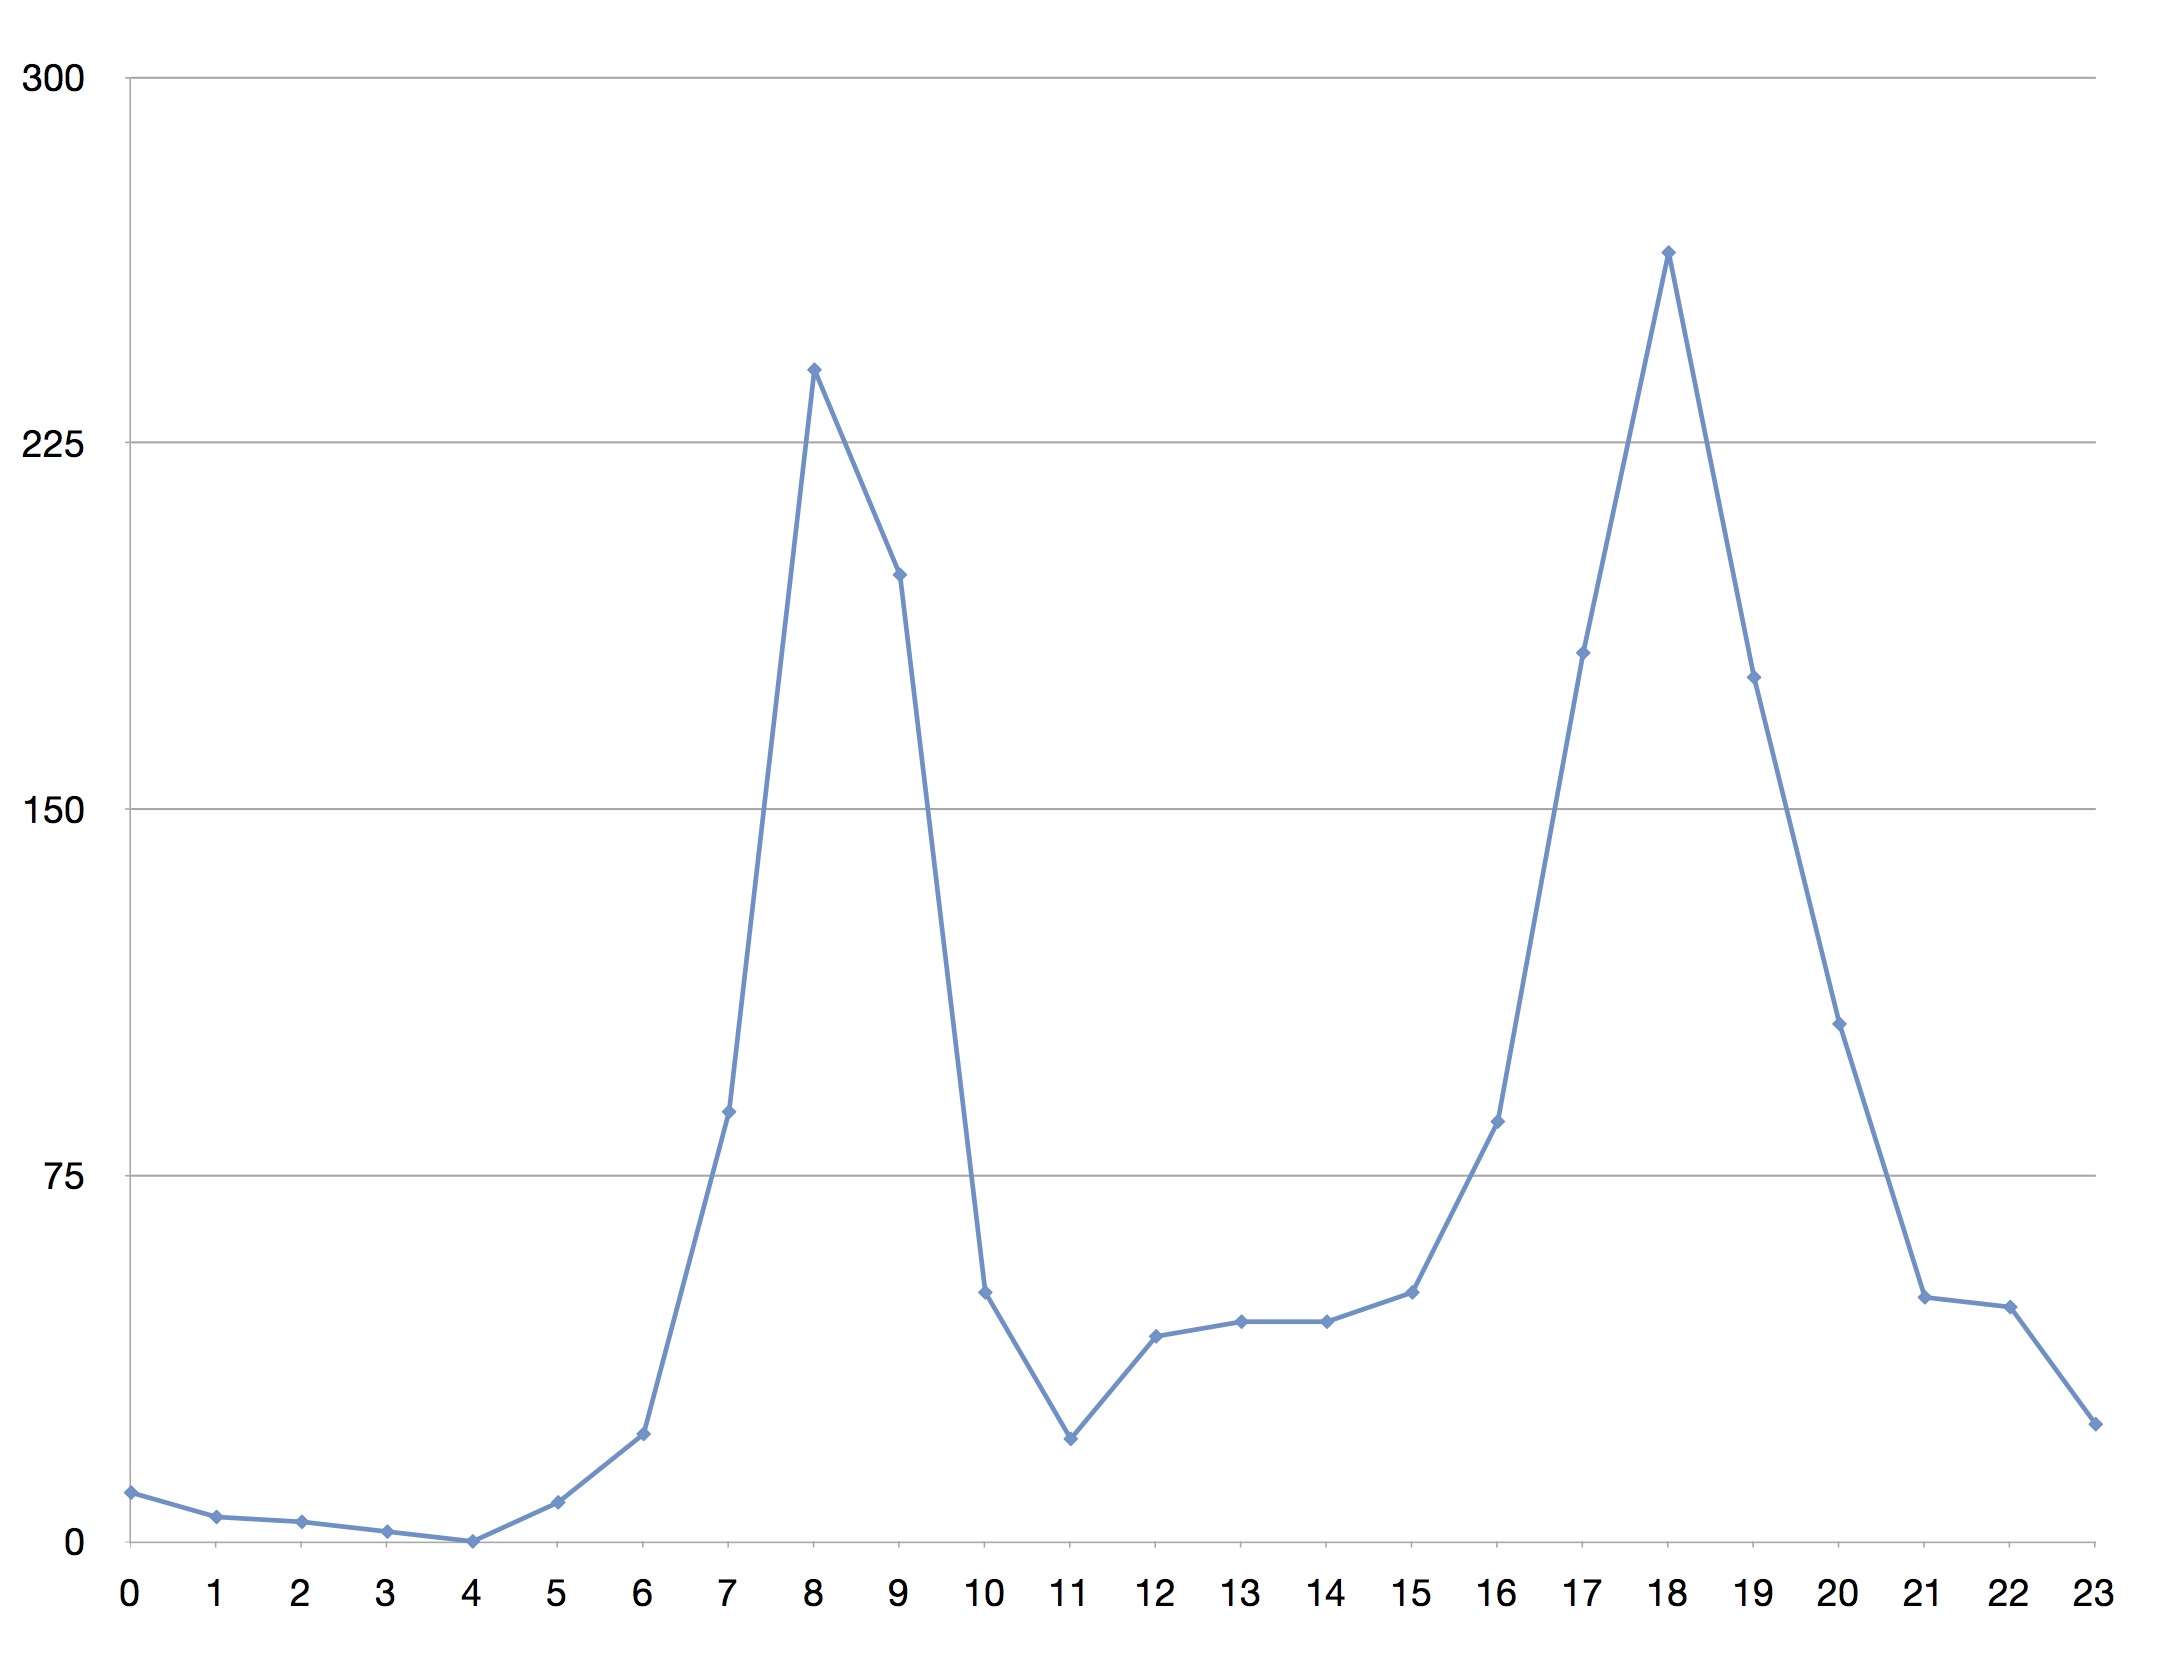
The chart 7 shows the hourly counts for Tuesday 3rd June 2014 – a typical fairly busy day.
The am peaks are 240 and 198 in the hours 8-9 am and 9-10 am. Evening peaks are 182, 264, 177 in the hours 5-6pm, 6-7pm and 7-8pm.
The counts drop to a low of 21 during the hour from 11am to noon.
Weather
This must have some effect on the number cycling but we have not attempted to correlate low counts with rainy days.
Comparison of 2014 and 2015
We have about six weeks of overlapping data but will wait until the end of the summer before making a comparison.