
Cyclestreets Bikedata map
Other Collision data
Traffic data
Roads, routes and infrastructure
Highway authority projects and announcements
Space4Cycling Campaign 2014
Other LCC and Camden Cyclists Maps
Economic Benefits of Cycling
LCC Policy Forum Documents
New Entries since 2017
Traffic Analysis Tool 
This tool conducts surveys of estimated motor vehicle journey times taking account of traffic congestion as estimated by Google Maps. The tool accepts a request for a specific route and collects Google’s predicted motor vehicle driving time repeatedly over any period of duration between 6 hours to 14 days. Authors/developers: George Coulouris and Richard Philpott
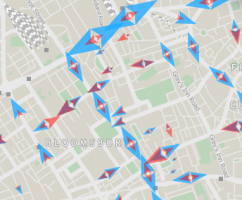
Cyclestreets Bikedata map
Provides an integrated clearly-mapped source for nationwide STATS19 collision data, Cycle theft reports, planning applications. DfT Traffic counts visualised in a novel way, and more including the Strava heat map of cycle journeys and information about the routes planned using the Cyclestreets Journey Planner. Use the tick boxes on the right of the map to select the data layers you want. You can filter the data by years and categories.
Visualisations of Camden’s Kentish Town O and D survey
In 2019, Camden’s council carried out motor traffic Origin-Destination surveys with entry-exit points on Kentish Town Road, Camden Road and Brecknock Road.
Michael Robinson, coordinator of HounslowCycling, had been working on detailed analysis and produced visualisations for surveys carried out in Chiswick used software called Tableau to produce a set of visualisations of the through routes as well as a version of the graphic shown by Karl Brierley
Cyclescape Issues Map
This map shows consultations and other campaigning discussion topics posted on Cyclescape the cycle campaigning discussion forum. Use the info link for further information.
We no longer use CycleScape (and it appears that other LCC groups don’t either). However, this map was used regularly before we dropped CycleScape. If we go back to CycleScape, this map should be linked from the ‘campaigning’ menu.
Other Collision data maps
Camden Cycle Collision Analysis 2008-2013 – was in a fusion table
 Shows the results of a detailed analysis of six years of reports on the collisions involving cyclists Camden. All collisions involving cyclist casualties are included – fatal, serious and slight. Use the Filters on the left of the map to view any of the 16 categories into which the analysis classifies the collisions (For example with ‘Left Hook’ selected):
- Hit open/opening door of parked car, Left Hook, Right hook, Right turn across cyclist path,
- Cut up to left, Cut up to right, Vehicle pulled out into cyclist path, Cyclist pulled out into vehicles path,
- Moved off from parked into cyclist path, Rear shunted the cyclist, Cycled into the back of vehicle, Cyclist lost control,
- Cyclist jumped red light, Vehicle jumped red light, Hit pedestrian, Other
Here is the original report with illustrations of the collision categories’ meanings.
Traffic data
DfT annual traffic census: downloadable tables and a nationwide map for all transport modes
Provides street-level traffic data for every junction-to-junction link on the ‘A’ road and motorway network in Great Britain.
DfT census data reworked to show PCUs: Nationwide 2003-12
This was an (withdrwan) Google Fusion table created by Alex Ingram. It has several tabs, some of which are displayed as browsable interactive maps. A click on a count point reveals the data for that point as a table for several years and vehicle types + PCUs.
DfT census data reworked to show PCUs for Camden 2003-12
This map has markers at the points in Camden where the Department for Transport makes a traffic count each year. Click on a marker to see a table listing the count figures at that point. Some ‘Passenger Car Units’ (PCU) figures derived from the raw counts are also included.
Made with Google ‘Classic’ maps. Created by Alex Ingram.
London Cycling Census Map April 2013
 London Cycling Census Map. TfL Traffic Census April 2013. Created by Oliver O’Brien, UCL Geography, from TfL survey data. More info here.
Strava’s Global Heatmap
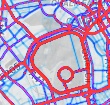 This impressive project draws on Strava’s huge dataset of rides logged by Strava users. You might wonder whether that has anything to do with utility cycling. In Strava’s FAQ they claim that nearly half of rides logged in ‘metropolitan areas’ are commuting rides. Of course even if that is true for the London section we can’t assume that it represents desirable routes used by a representative cross-section of people on bikes (and Strava don’t claim it does). But it does illustrate demand in a somewhat skewed way. Access to this public heatmap is free. It is complemented by a paid for service to access more detailed local Strava data.
This was brought to my attention by Jeremy Parker of Barnet Cyclists. He wrote:
… shows where experienced cyclists like to ride, and, perhaps more importantly, where even experienced riders avoid, Also, one can compare what cyclists like with what runners like – I would expect runners to care more about pleasantness, and less about directness. The map shows data for anywhere in the world, too: see how many people ride bikes in Greenland, for example
I find setting the style to “grey” works best. That makes the background map grey, and the trails of cyclists ranging from narrow and pale blue, for little used routes, to wide and red for those popular
Another interesting Strava spin-off is Strava Routes, a tool for constructing routes based on the popularity of the roads with Strava users.
Roads, routes and infrastructure
CycleStreets journey 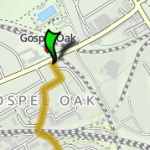 planner
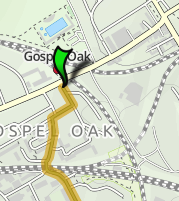
The best route finder! This is the web interface. Note that the CycleStreets routing engine is also in iPhone and Android apps of the same name and is embedded in several others including BikeHub and CityMapper.
CycleStreets photo 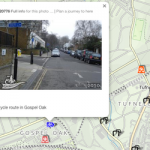 map
map
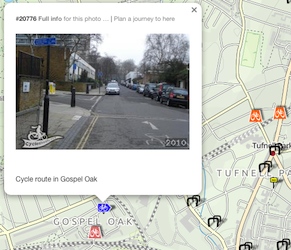
A huge collection of geographically-located photos made by cycle campaigners and other cyclists to illustrate infrastructure features and problems.
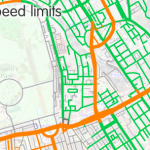
Open Cycle Map
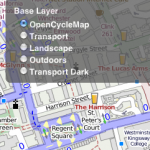
Open Cycle Map is an extremely useful derivative of the well-known radically-disruptive Open Street Map project. Open Cycle Map is a world-wide map rendering that shows signed cycle routes (e.g. in London, all the LCN and NCN routes, with numbers). It has several additional layers. The Transport and Dark Transport layers are useful for cycle campaigners since the show all of the bus routes, with route numbers in the higher zoom levels. To access them, use the menu that drops from the layers icon at the top-right of the map.
Bus and public transport maps
Andy Allan’s OSM-based Global Public Transport map can be used to check London bus routes and many other things.
Matthew Somerville’s Live London Bus Map shows the real-time locations of the buses on any London bus route. He has also produced an interesting Live London Tube Map. Both maps use TfL data feeds.
Highway authority projects and announcements
THE GAZETTE 0fficial UK government record
A tedious but useful way to discover infrastructure changes planned by local authorities and other agencies. Here are Dominic Fee‘s suggestions on how to use it to get relevant data:
THE GAZETTE lists proposed and made Traffic Management Orders (TMOs). These are the legal orders that support features such as banned turns, parking restrictions and mandatory cycle lanes. Any permanent TMO must be subject to consultation, giving cycling campaigners the opportunity to comment on features such as banned turns where an exemption for cyclists could have been included.
I use the website by clicking on ‘All notices’, then clicking the arrow to expand ‘Environment & infrastructure’ and clicking on ‘Roads & highways’, then clicking the arrow to expand ‘Location’ and clicking on the relevant local authority, then clicking ‘Update results’.
Space4Cycling Campaign 2014
Camden Cycling Campaign Space4Cycling 2014 Election Wards and Asks
 A multi-layer map made for the LCC’s 2014 ‘#Space4Cycling’ campaign. Several of the layers contain information that should be generally useful. Select the layers you want to view. (Those labelled in brown below are specific to the LCC’s 2014 ‘#Space4Cycling” campaign).
Layers:
Schools & travel modes (2011): Schools and Colleges in Camden – clickable markers showing details of Camden schools and colleges with travel modes used by their pupils. Data is from a 2011 survey. Travel mode data is based on informal surveys of pupils and none is available for private schools and colleges.
KSI Collisions 1994-2012: Locations and details of 16 fatal and 481 serious-injury collisions involving cyclists in Camden in this period.
Space for Cycling Survey Results: Survey responses from 320 LCC members showing their individual ‘Asks’ in Camden (each with a clickable marker).
Ask Summaries: 37 entries derived from the survey results as a first step towards identifying a single ‘Ask’ for each ward – to be put to all of the candidates by LCC members in those wards.
Final Asks: This layer was never completed but the Asks finally selected can be found on this page on the LCC website.
Made by George Coulouris with Google Maps Engine Pro, using data provided by Alex Ingram.
Here is a page with details on this map’s construction and use.
for making available much of the data used to build this map.
Other LCC and Camden Cyclists Maps
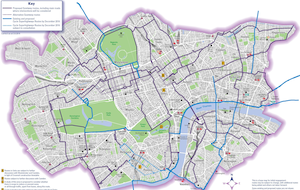
Protected cycling routes in Camden 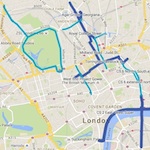
An interactive map showing progress with the network of protected cycling routes in Camden. The bulk of these routes comprise wide segregated tracks and protected junctions. Further routes awaiting approval or construction and others under discussion can be viewed.
Camden Permeability Issues Map
An ongoing record of issues raised by members that have been put to Camden, showing current status and successes. See legend for symbol explanation.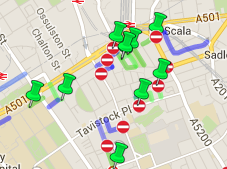
Maintained by Jean Dollimore
TfL’s 2016 Central London Cycling Grid plans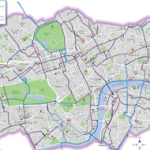
Showing routes scheduled for completion by 2016. (map date: 2014).
Economic Benefits of Cycling
This is a really good report from TfL that debunks many of the myths about cars and shopping etc.
LCC Policy Forum Documents
The documents below were produced by the LCC Policy Forum but they seem to have gone missing from the LCC website, so they are archived here:
LCC’s 2014 London Elections Campaign POLICY THEMES – a digested summary of the set of six policy themes formulated by the LCC Policy Forum (2014).
Areas without Through Motor Traffic – a 2-page statement of the Policy Theme 2, with references to examples
This page was created by George Coulouris. Comments and suggestions for additions are welcome. Please send email to George Coulouris. Some updates 14 January 2019.