Geoff Stilwell introduced Lucy Saunders who leads on the integration of transport and public health at TfL and the Greater London Authority.
Lucy started by saying the the new Deputy Mayor for Transport Val Shawcross is keen to drive forward the Healthy Streets approach that she developed.
It can be difficult to measure the health impacts of transport and streets. Traditional measures include injury reports, Air Quality and noise measurements and levels of active travel – which are usually the biggest health impact.
The Healthy Streets approach
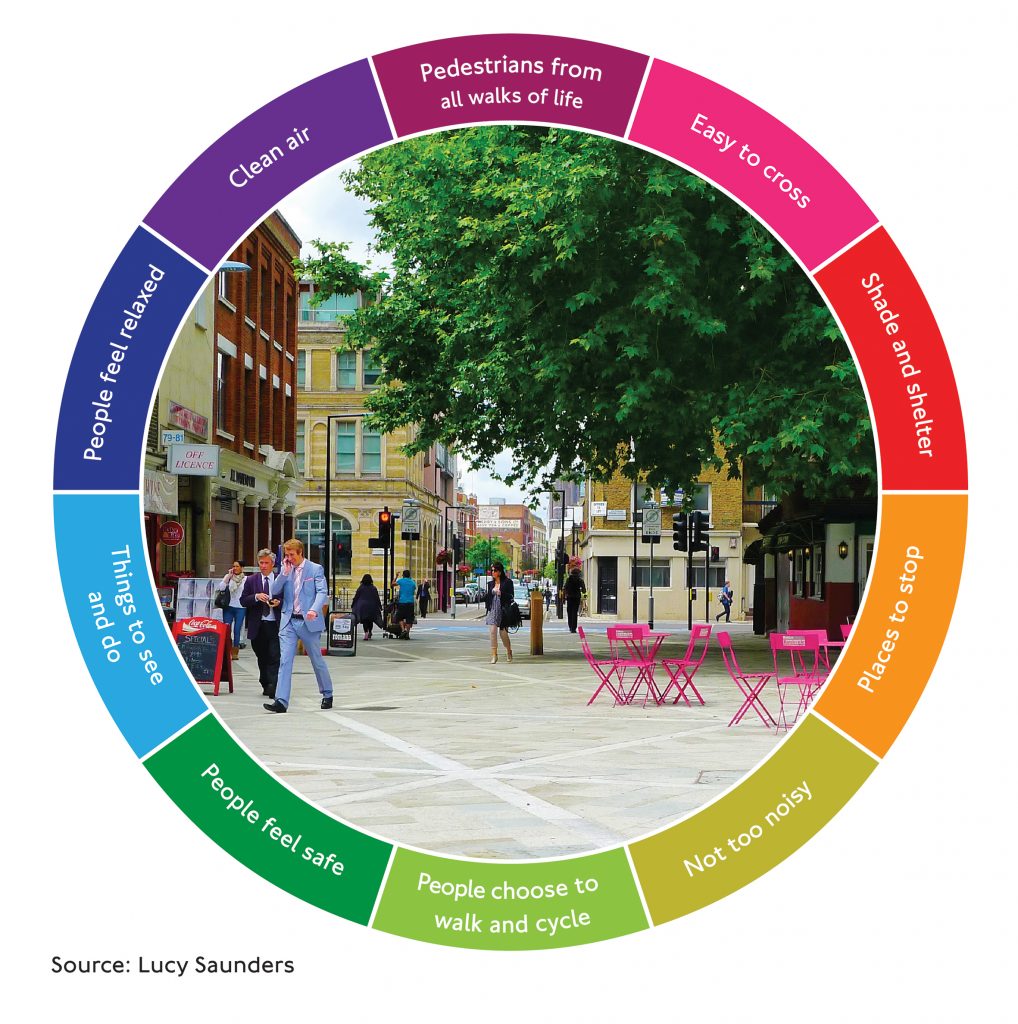
The Healthy Streets approach is focused on delivering ten indicators of a healthy street. Lucy illustrated each one with an example:
- Easy to cross – a wide and inviting pedestrian crossing in New York
- shade and shelter – example from Sydney where the shade is needed as respite from the hot climate
- places to stop – a ‘parklet’ in Hackney
- not too noisy – the Cut where temporary planting screens the traffic noise
- people feel safe– Turnpike Lane DIY street with trees in containers
- things to see and do – example from Copenhagen
- people feel relaxed – Montreal with seats and plants
- clean air – a view of Seoul where a street has been made into a canal
- people choosing to walk and cycle – Montreal cycleway
- pedestrians from all walks of life – Van Gogh walk in Southwark (looks a bit like a playground)
Why Healthy Streets?
The new Mayor and Val Shawcross like the concept because it is focused on delivering a healthy and inclusive environment for everyone. Taking a stronger focus on health will mean TfL includes the economic effects of health benefits as well as safety and moving vehicles when making the business case for new schemes.
Lucy provided a visual example of a parade of shops and made a variety of transformations such as widening the footway, lowering speed to 20 mph, adding trees and suggesting other forms of shelter such as awnings and colonnades. Then for places to stop and rest, she pointed out that you don’t have to stick to benches; low walls and planters are useful too. Buildings that face the street make people feel safer and it’s always worth introducing interesting things to look at.
Healthy Streets Survey
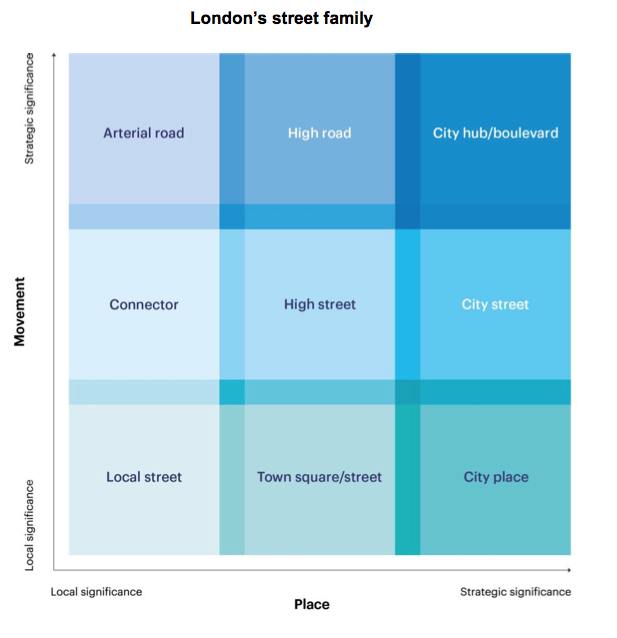
Lucy referred to the 9 street types defined by the Roads Task Force. They are arranged in a 3×3 array with Movement on one axis and Place on the other.
An on-street survey was carried out on streets of all the 9 types. People on the pavements were asked about their experience and their expectations for each of the indicators of a Healthy Street. . The first surveys in 2014 were throughout London. In 2015, surveys included 27 locations in Camden.
These surveys showed that the more traffic dominated streets scored lowest across all the indicators. The surveys are useful for showing people’s real experiences on London’s streets but they cannot be used to assess new designs for proposals
Healthy Streets check
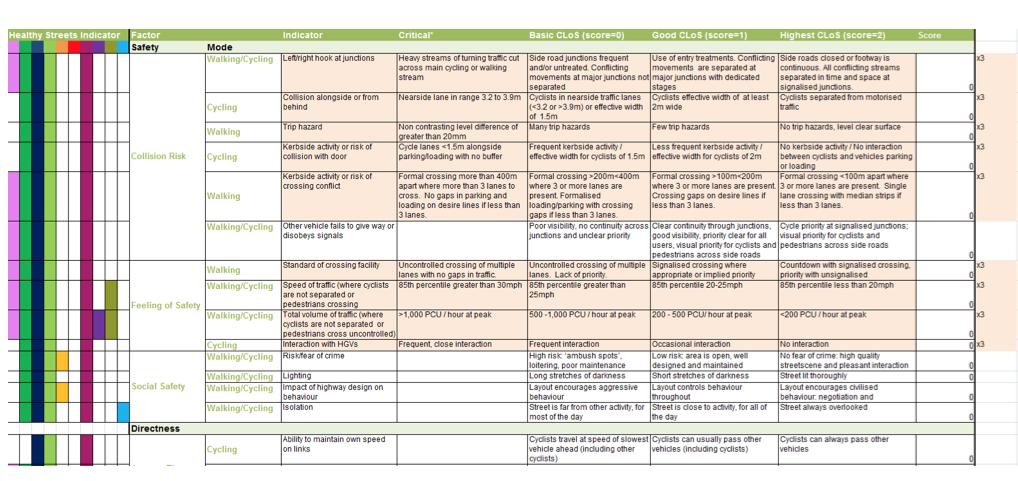
The Healthy Streets Check is being developed to try to identify objective measures that can be assessed for proposals for new schemes to ensure they are creating a healthier street in the round These were all put into a giant spreadsheet that looks quite like the one for CLoS (LCDS Cycling Level of Service). Like CLoS it does look for ‘left hooks’ and ability to keep going at your own speed.
The spreadsheet can be used to evaluate schemes at design stage by considering each thing in the road between the two building lines.
Some examples evaluated by the tool:
Leonard Circus: the scores before and after were compared and on most indicators there was a big improvement, although in the audience commented that they hate cycling along it.
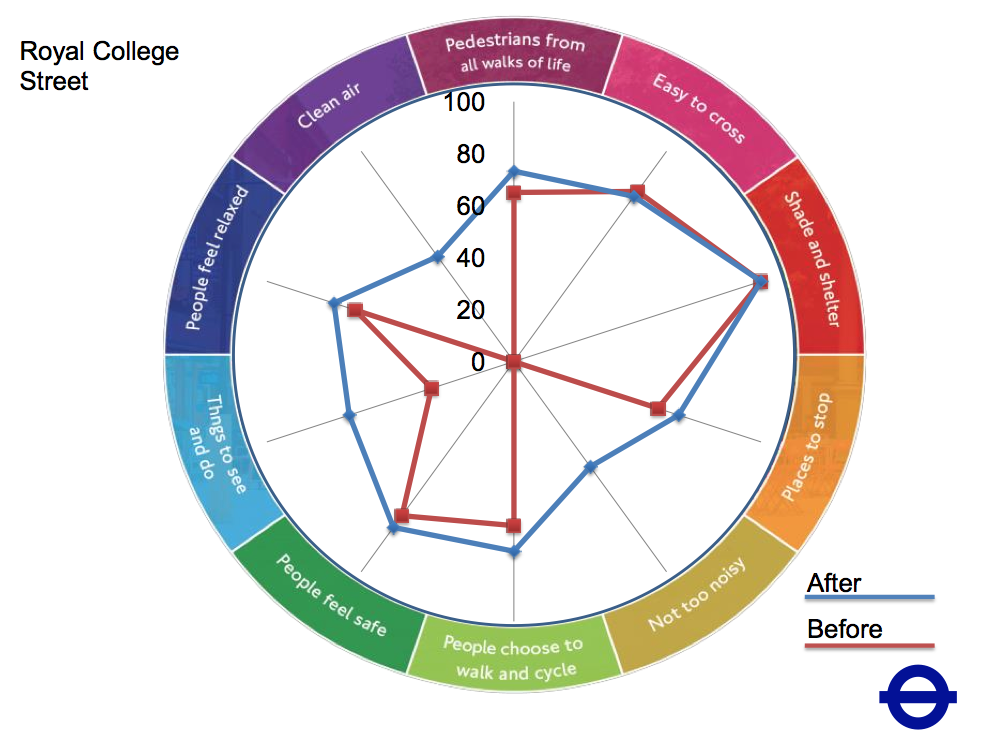
Royal College Street: we were disappointed that the measure for safety and for pedestrian environment did not show a bigger increase. There were no counts of pedestrians before and after the scheme was put in so the monetized benefit of any increase in walking could not be calculated
Holborn Circus:There was a big increase in pedestrian use, levels of cycling before and after the scheme was put in were not measured so it is not known if cycling increased or not. There was no improvement to the noise or clean air measures. When a monetary value was applied, the result was very high because of the positive aspects for pedestrians. .
Lucy said that Boroughs with Mini Hollands see the tool as a way forward.
Lucy’s slides as presented to Camden Cyclists [PDF 5.9 Mbytes] If Lucy allows us, we will provide a link to her slides.
See more of the Photos by Geoff Stilwell.

