Ever since the previous day’s cycle counts for Royal College Street and Pancras Road have been displayed on the Home page of this website, people couldn’t help noticing that during most weeks, the counters were continuing to provide high values even during the chill in December and January. This post compares weekday averages for the months September – October 2016 with those for November – January and finds only a small decrease in numbers.
The cycle counts described below consist of the sum of north and southbound cycles.
How much effect does the cold weather have on the number of people cycling?
Royal College Street
Do daily counts since September 2016 show any decrease as the weather gets colder?
A previous post More people using Royal College Street showed that the number of people using the Royal College Street tracks had increased soon after the norther extension was opened. Due to this effect, the counts for last summer are mostly lower than those during this winter. It therefore seems appropriate to start the comparison from September.
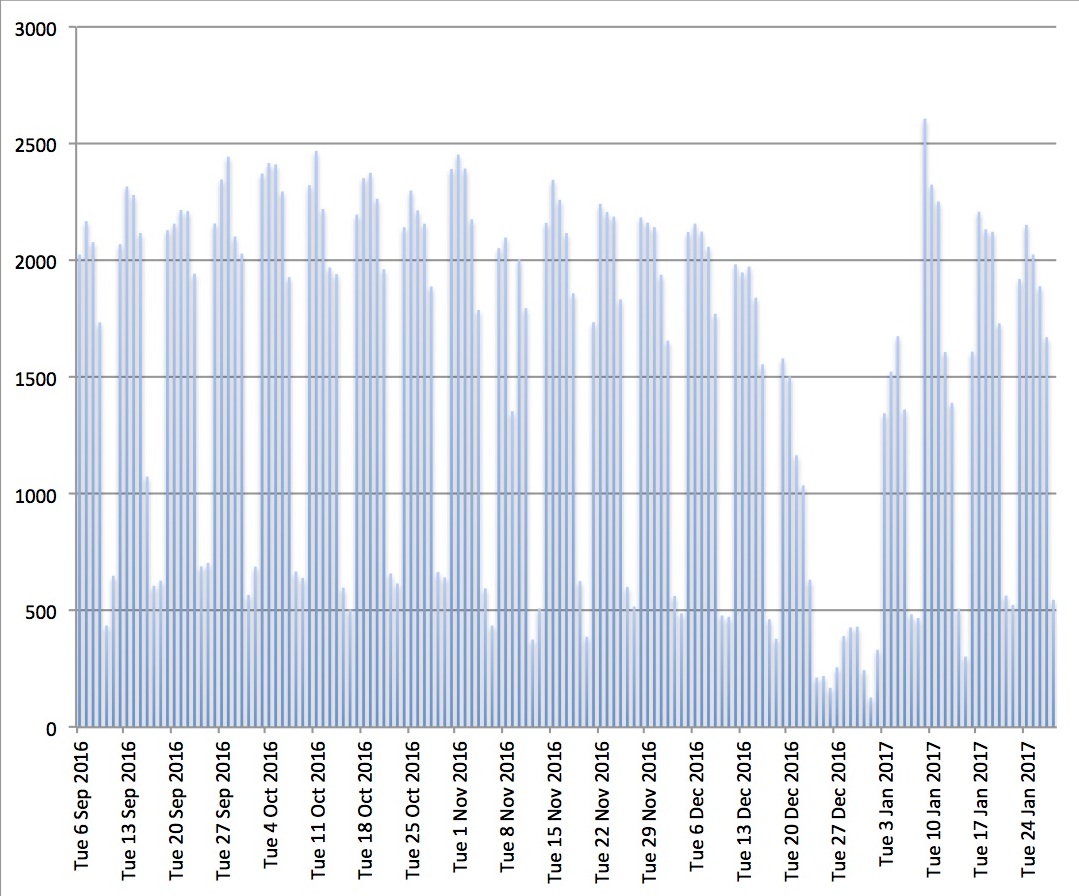
Apart from the Christmas–New Year period, over 2000 cycling trips were made on Royal College Street on several days each week throughout the autumn and winter months.
The chart in Figure 1 is derived from the daily counts from September 2016 to January 2017. This shows that even during December and January (omitting 19th December – 8th January) all but three weekdays had counts above 1500 and during most weeks it exceeded 2000 on 3 or 4 days.
The highest count of 2607 occurred on Monday 9th January, the day of a Tube Strike in Zone 1, similar to, but a little smaller than the count of 2627 on Thursday 9th July 2015 when there was a 24-hour tube strike.
The average weekday count over this period is 1903. However, if the three quiet weeks around Christmas are omitted, then the average weekday count is 2067.
On comparing the warmer months, September–October, the weekday average is 2133 and the colder ones, November to January (without Christmas) the weekday average is 2013. This is a reduction of about 5%.
What caused those three very low daily counts?
The NW3 Weather station site can be used to find out rainfall, temperature and other weather measurements on each day of the year. The three weekdays in Figure 1 with counts below 1500 are
- Friday 16 Sept: rainfall 20.6 mm
- Wednesday 9th November: rainfall 20.8 mm
- Friday 13th January 2017: rainfall:15.9mm (and a little snow had fallen on 12th January)
The first two of those days have the heaviest rainfall over the period. The next highest rainfall was 15mm on Monday 21st November where the cycle count was 1735 which is low for a Monday.
All the other days with 10mm or more rainfall during this period were at weekends.
Temperatures
The weather station also provides temperature recordings. In January 2017 there have been 10 days with maximum temperature below 5˚ C, the coldest being on Thursday 26th at 0.4˚ C when 1889 people on bikes were counted on Royal College Street. During the period September-December 2016, the only day with maximum temperature below 5˚ C was 28th December.
A look to see whether unusually low cycle counts can be related to rainfall earlier in 2016
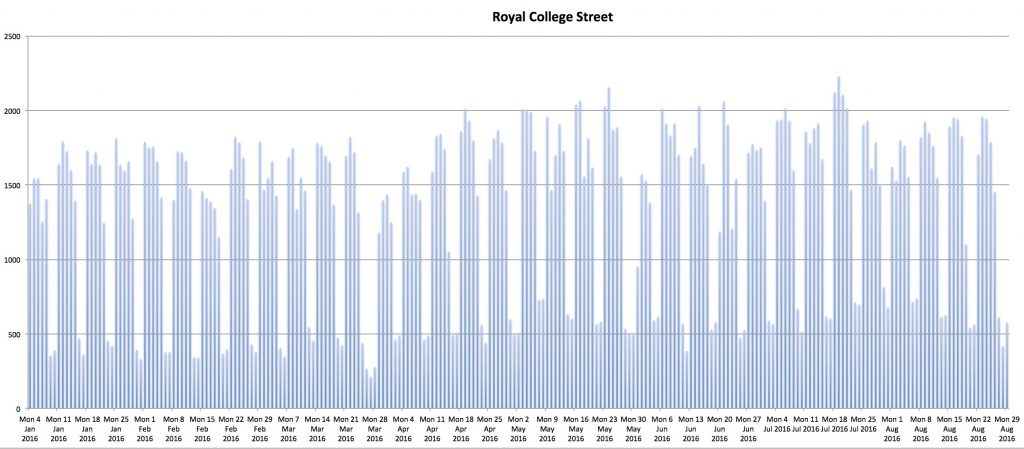
The chart in Figure 2 is derived from daily counts from January to August 2016
During this period, excluding the Easter, May and August Bank Holidays, all weekday counts were above 1100, with the two exceptions. The list below shows these together with some counts that were lower than others in the same week:
- Thursday 7th January: count 1255; rainfall 11.8 mm
- Friday 15th April: count 1051; rainfall 30.4 mm, the highest value recorded for 2016
- Tuesday 31 May: count 951; rainfall 12.4mm
- Monday 20th June: count 1187; rainfall 15.2 mm
- Thursday 23rd June: count 1206; rainfall 21.1 mm
Three other counts that appeared to be lower than others in the same week were on three virtually rain-free Fridays in January and February, the lowest of these was on Friday 19th February whose count was 1151.
Cold weather and snow
During 2016, only 8 days had a maximum temperature below 5˚ C. These were:
- January 15th-20th, including 3mm snowfall on Sunday 17th.
- February 13th and 25th
- December 28th
A glance at Figure 2 should convince us that people who cycle are not daunted by cold weather!
What can we see in the monthly counts since the data was recorded?
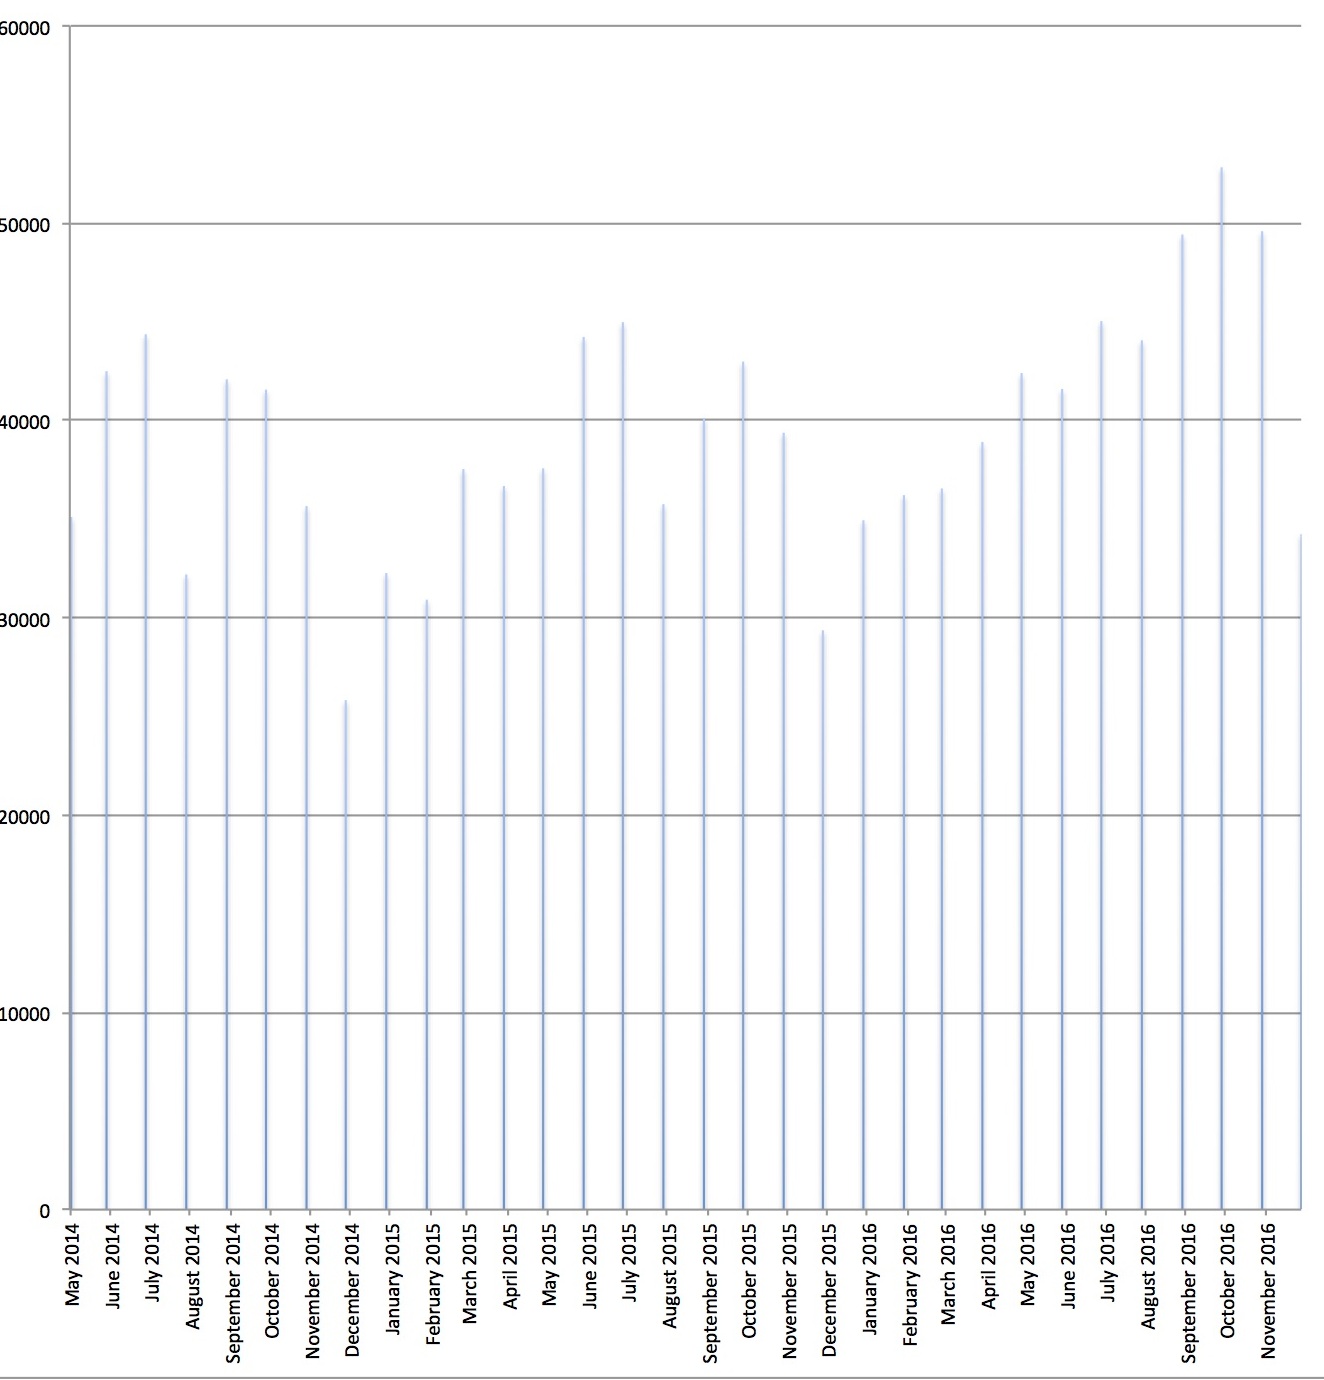
The chart in Figure 3 is derived from the monthly total counts from May 2014 to November 2016. It can be the basis for comparing the number of cyclists in summer months with those in winter months. August figures tend to be lower that those in other summer months and December- January is affected by the Christmas-New Year period.
Therefore let’s compare June–July 2014 with February–March 2015: we find a decrease of 21% in the number of cyclists
and comparing June–July 2015 with February–March 2016: we find a decrease of 18% in the number of cyclists.
Pancras Road
Daily counts since September 2016
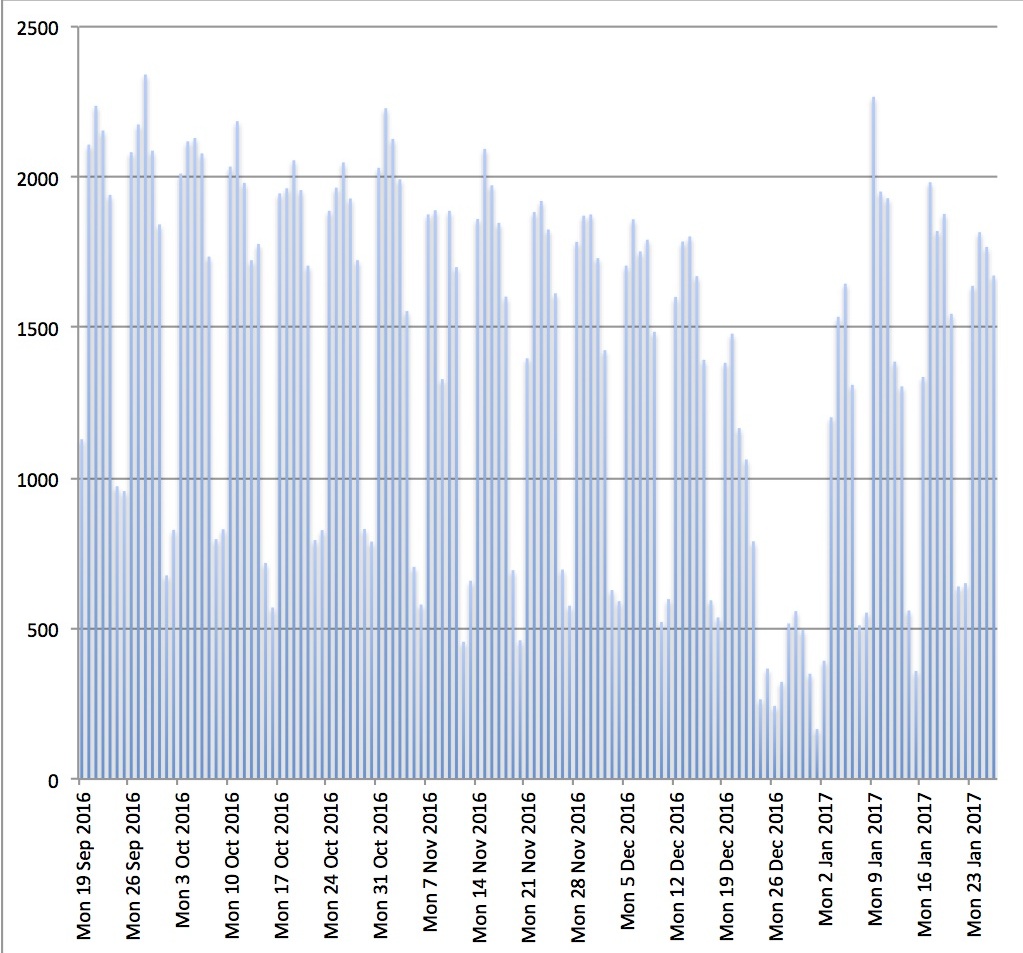
The Pancras Road counter was out of service this summer, but we have counts since 19th September.The chart in Figure 4 is derived from the daily counts from 19th September 2016 to 28th January 2017. The numbers are a little lower than Royal College Street but the pattern is similar.
The highest count of 2341 occurred on Wed 28th September but the next highest (2267) was on Monday 9th January, the day of the Tube Strike.
The average weekday count over this period is 1697. If the three lowest weeks around Christmas are omitted, then the average weekday count is 1839.
Or comparing the warmer months, September–October, the weekday average is 1939 and the colder ones, November and January (without Christmas) the weekday average is 1780. This is a decrease of about 8%.
Tentative conclusions
The above calculations based on people using the cycle tracks on Royal College Street and Pancras Road show that that there is only a moderate reduction in the number of people travelling by cycle in the colder months. This was more marked during the first two years (12% and 18%) than it was in the third (only 8%). But the last figure was based on a different calculation.
When inspecting our charts for ‘outliers’ with readings lower than the norm for that time period, we found that almost all of these were on days with high rainfall.
The weather data also allowed us to identify days with snow or temperatures below 5˚ C. Snow was minimal during this period of study but the low temperatures did not appear to cause a decline of cycling relative to that time of the year.


