

Camden Council has been engaging with local stakeholders regarding the Kentish Town Healthy Streets Project. Karl Brierley who is is Camden’s Principal Transport Planner for Low Emission Neighbourhoods and Healthy Streets gave a talk at our February meeting.
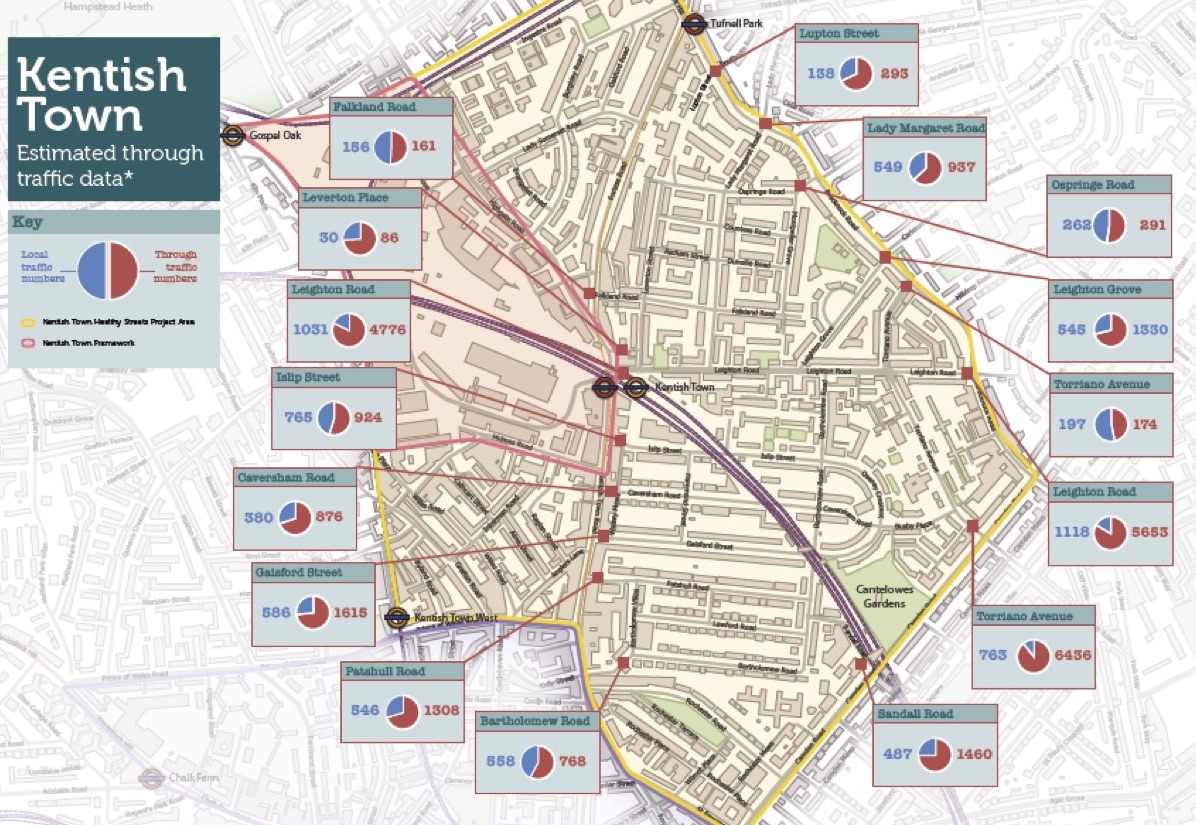
This included a slide with a visualisation of Camden’s motor traffic Origin-Destination surveys with entry-exit points on Kentish Town Road, Camden Road and Brecknock Road. A journey was considered as local if it entered the area without leaving within 15 minutes.
Soon after this, we heard that Michael Robinson, coordinator of HounslowCycling, had been working on detailed analysis and produced visualisations for surveys carried out in Chiswick.
Michael expressed interest in seeing Camden’s Origin-Destination surveys and within the framework of a FoI request, Karl Brierley supplied us with the data which we passed on to Michael.
Michael has used software called Tableau to produce a set of visualisations of the through routes as well as a version of the graphic shown by Karl Brierley.
Tableau Visualisations
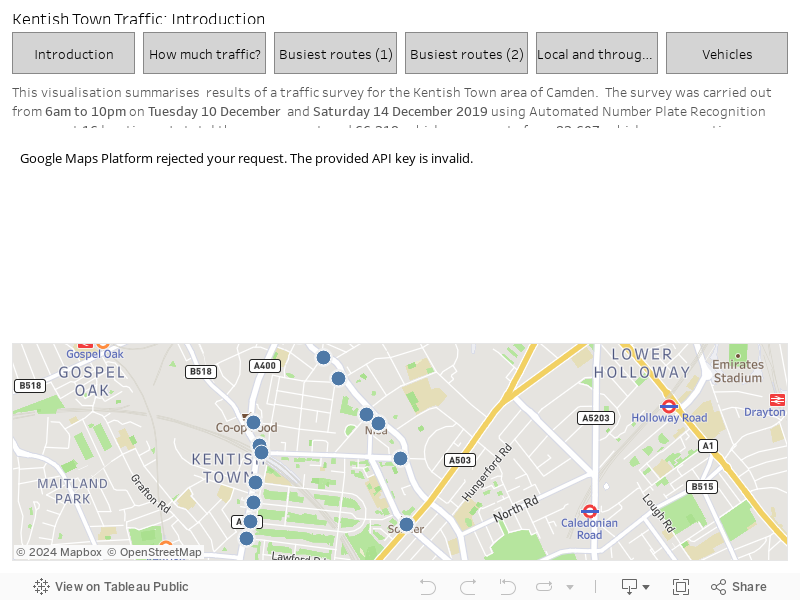
These are available more directly on the Tableau site. If you want full control of all the interactions, it is better to work on the Tableau site.
Some examples of what can be found from a brief tour of what’s shown under each Tab:
- Introduction: click on any of the survey points to see StreetView
- How Much Traffic?: click on any of the survey points (whose radius relates to the traffic flows) to see a line where rolling over shows the hourly traffic levels throughout the day. E.g. Gaisford Road has 1701 daily and 164 in the peak hour – very unsuitable for an access road (not TLRN or SRN† or even an emergency route)
- Busiest Routes (1): click on any of the survey points to see the trips going through that point.
- It starts up with a view of Torriano Avenue (S) the point with the highest counts and lists the three top trips – Leighton Road E and W and Gaisford Road (at Kentish Town Road).
- It should be noted that although Leighton Road and Torriano Avenue are bus routes and emergency services routes, they are not on the SRN or TLRN† and should not be carrying this level of traffic.
- Try selecting, for example, Sandall Road whose top trips involve Patshull Road, Bartholomew Road (at Kentish Town Road) and Gaisford Road
- Busiest Routes (2): starts up with a view of the three busiest trips in the area. A slider can be used to vary the number of top trips. This is very interesting because the largest numbers appear to affect a small number of roads. Sandall Road and Gaisford Road appear in the top five.
- Local and Through Traffic: is the equivalent to Camden’s slide shown above but with the radius of each blob corresponding to the traffic flow. Rolling over will display the numbers below the red (through routes) and the blue (local routes). This tells us a lot about rat-running through the access roads. For example, the following table shows survey points which have more than 50% through trips – all of them being access roads
| Local | Through | Total | % through | |
| Sandall Road | 487 | 1460 | 1947 | 75 |
| Gaisford Road | 586 | 1615 | 2201 | 73.4 |
| Patshull Road | 546 | 1308 | 1854 | 70.6 |
| Caversham Road | 380 | 876 | 1256 | 69.7 |
| Leighton Grove | 545 | 1330 | 1875 | 70.9 |
| Lady Margaret Road | 549 | 937 | 1486 | 63.1 |
| Islip Street | 681 | 1008 | 1689 | 59.7 |
| Barthlomew Road | 558 | 768 | 1326 | 57.9 |
- Vehicles: This tab shows the number and type of motor vehicles passing through each access point.
Sankey Diagram
In addition, Michael has produced variations on a Sankey diagram – a type of flow diagram in which the width of the lines is proportional to the rate of flow. This different style of drawing is very powerful: an example is included below.
These diagrams are available in a google sheet.
The diagram below shows the flows from a survey carried out from 6 am to 10 pm on Tuesday 10th December using Automatic Number Plate Recognition cameras at 16 locations (the locations are shown in the chart from Karl Brierley’s talk above). The cameras captured 66,318 vehicle movements from 23, 607 vehicles comprising about 38,000 trips.
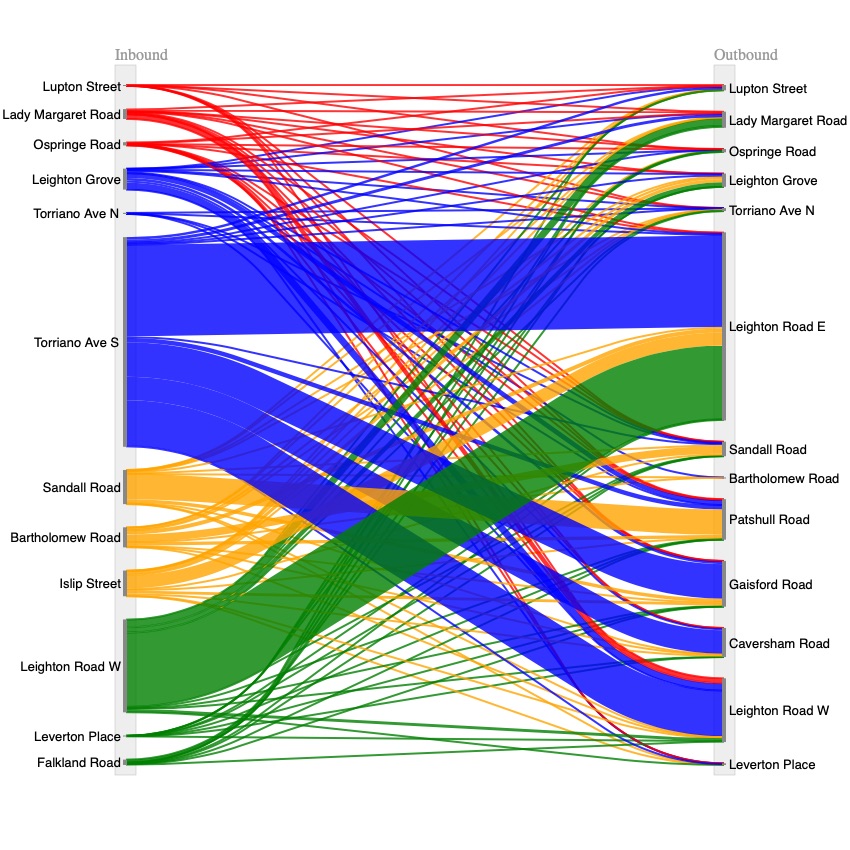
Interpretations of the Sankey diagram
The Sankey diagrams give an overview of what can be studied in more detail in the Tableau visualisations. For example from the above Sankey diagram the top flows are, in order from largest to smallest:
- Torriano Avenue S (at the junction with Camden Road) brings the most traffic into the area with
- almost half leaving the area at Leighton Road E (at the junction with Brecknock Road)
- and a quarter heading via Busby Place and Gaisford Road or Caversham Road to Kentish Town Road
- while the remainder heads to Leighton Road W (at the junction with Kentish Town Road)
- Leighton Road W (at the junction with Kentish Town Road) is next:
- with the bulk of the traffic leaving the area at Leighton Road E (at the junction with Brecknock Road)
- and a significant flow through Lady Margaret Road to Brecknock Road
- Sandall Road (at the junction with Camden Road) follows with most of the traffic leaving the area via Patshull Road into Kentish Town Road
- Islip Street (at the junction with Kentish Town Road) with most of the traffic leaving the area at Leighton Road E
- Bartholomew Road (at the junction with Kentish Town Road) with most of the traffic leaving the area at Sandall Road
- Leighton Grove (at the junction with Brecknock Road) with most of the traffic leaving the area at Leighton Road W and Patshull Road
† TLRN: Transport for London Route Network, also known as ‘Red Routes’ managed by Transport for London.
SRN: Strategic Route Network, streets that are recognised by the local borough and by TfL as through routes for motor traffic.
For definitions see the Camden Transport Strategy 2019-2041 (page 32 and the map in figure 2.3 on page 31).