This report is based on the data collected by the cycle counter in Royal College Street for the twelve months from 1st May 2015 to 30th April 2016. (See this page for details on Camden’s cycle counters and access to current and historic data). The cycle counter was installed in Royal College Street in mid-April 2014. See a report on the counts during the first year of operation.
Royal College Street – yearly totals
For the twelve months from 1st May 2015 to 30th April 2016 the total number of cycles comes to 464,911, compared with 440,849 in the previous twelve months. Once again, the number of northbound cycles was almost twice the number going southbound (about 63% of the total). For the record, the total counted from the installation in April 2014 to the end of June 2016 is over a million (1,023,900).
Royal College Street – monthly data 1st May 2015 to 30th April 2016
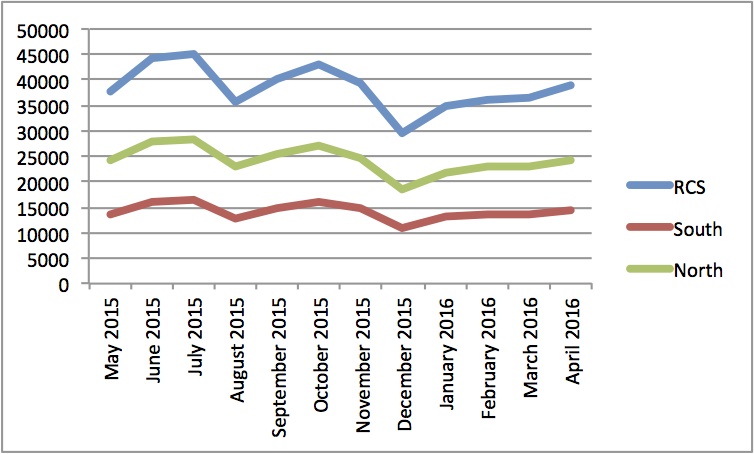
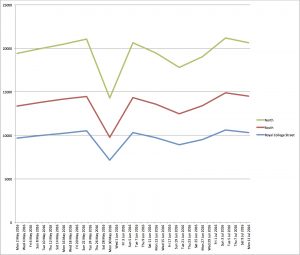
The chart on the right shows monthly totals between May 2015 and April 2016. June (44,232) and July (44,982) were the busiest months, while December (29,364) was the quietest. August, when people tend to be on holiday, drops to 35,758 but September and October both reached 40,000 or more.
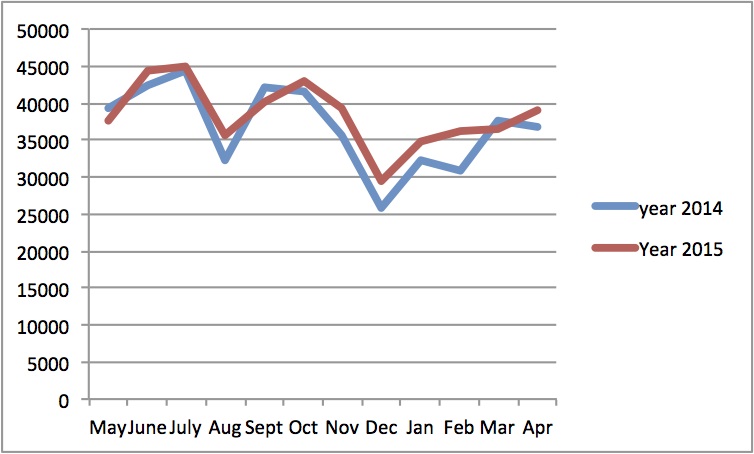
The chart on the left compares the monthly counts for the first two years showing a very similar pattern through the months and a small increase from the first to the second year.
Weekly data show peaks of 10 to 11 thousand
This refers to data over the entire week including weekends.
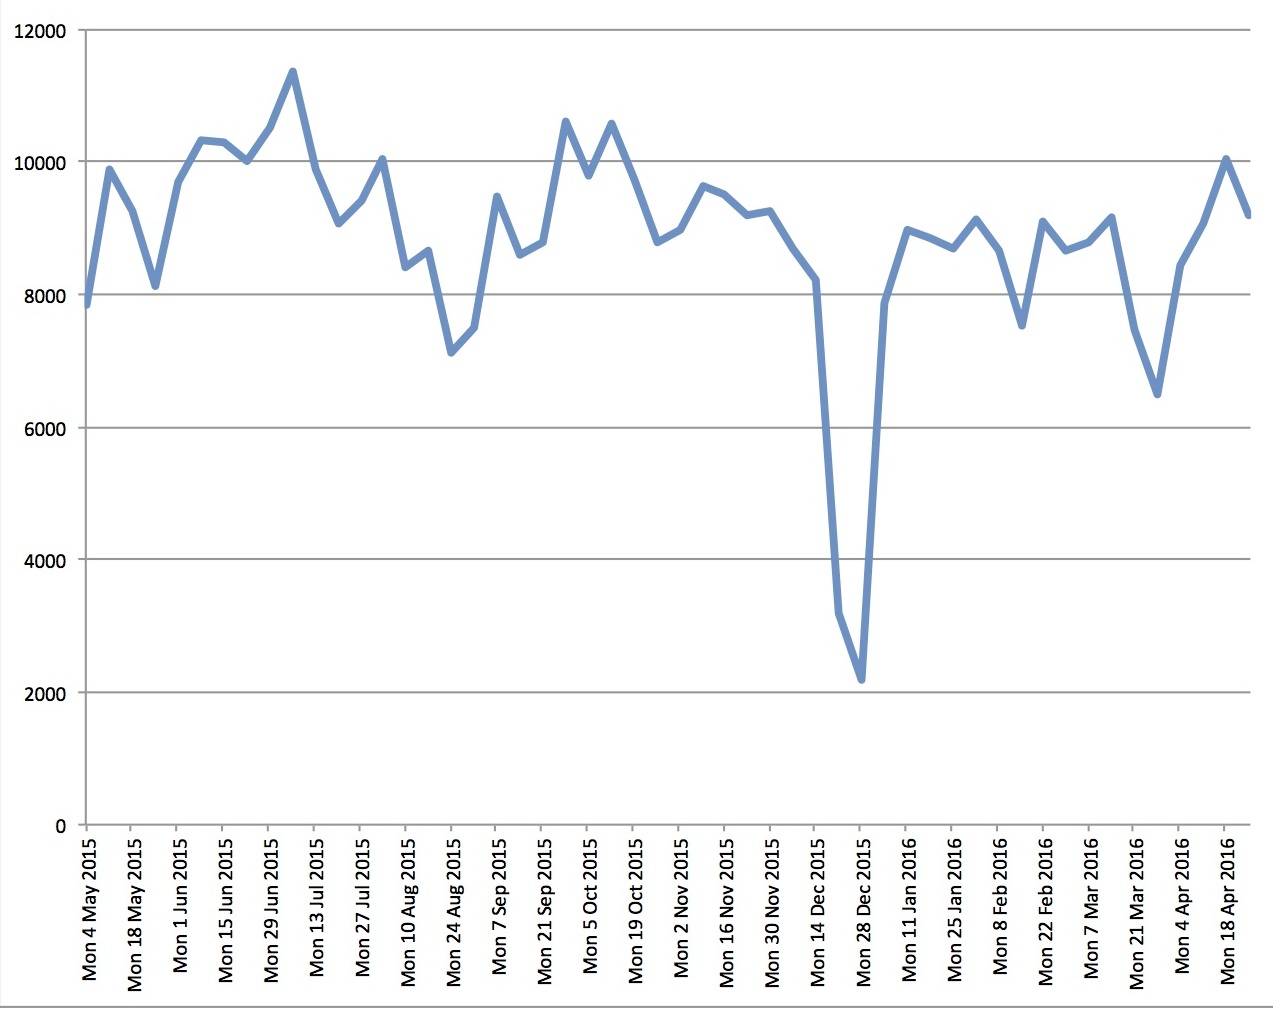
The chart on the right shows the total counts (northbound + southbound) for each week in the yearly period from Monday 4th May 2015 to Monday 25th April 2016. The average weekly count comes to 8817 cycles with 5571 northbound and 3245 southbound.
High counts: The week starting on 6th July 2015 has the highest total of 11,346 cycles but altogether nine weeks have totals over 10,000. The only week in 2016 going over 10,000 cycles is the week starting on 18th April.
Lowest counts: The two lowest weekly counts (of 3193 and 2169) come around Christmas and New Year between 21st December 2015 and 4th January 2016.
Fluctuations around 9000 per week: Apart from the Christmas weeks, only one other week drops below 6000 – starting on 30th March, just before Easter 2015. And only four more are below 7000.
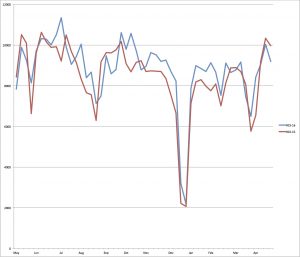
The chart on the left compares these counts with those in the previous year (dates for corresponding weeks offset by one day). Why are there the same dips early in February, mid March (Easter dates differed), towards the end of May and in August?
Daily data 1st May 2015 – 30th April 2016
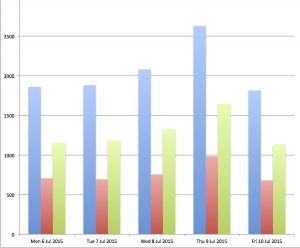
On Thursday 9th July 2015 the counter recorded the maximum daily total of 2627 cycles with 1644 northbound and 983 southbound (see the chart on the right: blue = total, green = northbound and red = southbound) – by far the highest daily count since the counter was installed. A 24-hour tube strike had started the evening before. At a previous tube strike on 30th April 2014, 2,414 cycles used the route, so it looks as though there is an increase in the number of people who will come out to cycle when necessary. However the count exceeded 2000 on only 11 days throughout this yearly period.
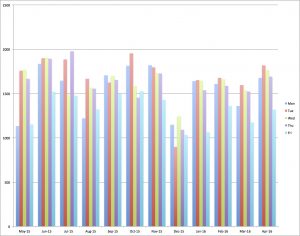
The average weekday count is 1582 but some days are more popular than others… looking at each of the 52 weeks, we find that Tuesdays are the most popular, having the highest counts in 22 weeks; with Mondays, Wednesdays and Thursdays the highest in 10, 9 and 11 weeks respectively.
Looking at the totals for each day of the week throughout the year, we also find that more cycles go through on Tuesdays than on any other day.
The chart on the left shows the monthly averages for each weekday with Tuesdays in red.
Hourly Data 1st May 2015 – 30th April 2016
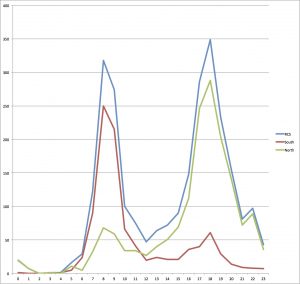
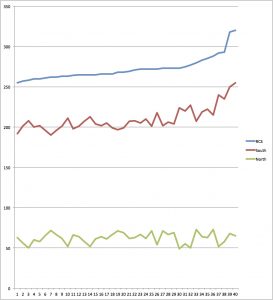
The largest hourly count over this period occurred on Thursday 9th July 2015 during the 6-7 PM peak, on the day of the tube strike. The chart on the left shows the counts throughout that day. It also shows that in the morning, southbound counts far exceed northbound counts. The chart on the right shows the 40 largest counts for the 8-9 AM peak in all of which, the southbound counts far exceed northbound counts. In fact it is about 77% of the total.
Data since 1st May 2016 – will the opening of the northern extension make a difference?
The chart on the right shows the weekly counts for the six weeks since the beginning of May with a dip for the Bank Holiday at the end of May, The figures for May were higher than the previous year, but in June they were lower.
The northern extension was opened in July so it is too early to consider whether it will increase the counts or change the dominance of northbound over southbound counts.
Counter in Pancras Road
This counter was installed on 22nd September 2015, so we should have data for about 10 months.While doing the analysis, we noticed that the computer was not recording data from 18th June until 20th July when we could also see that the display was not incrementing correctly. We reported the problem to Camden. In addition some of the counts before the 18th June looked strange. Once the counter has been fixed and the reliability of the data checked, I hope to be able complete this report.

