
Last week, George Coulouris reported on how easy it is to look at the data on the cycle counters in Royal College Street and Pancras Road. A few glances at the counts makes it evident that over two thousand cyclists are using Royal College Street on almost every weekday.
The Royal College Street northern extension to Kentish Town opened in July, so it could be interesting to see whether the increase in numbers started around that time and also to look at the size of the increase.
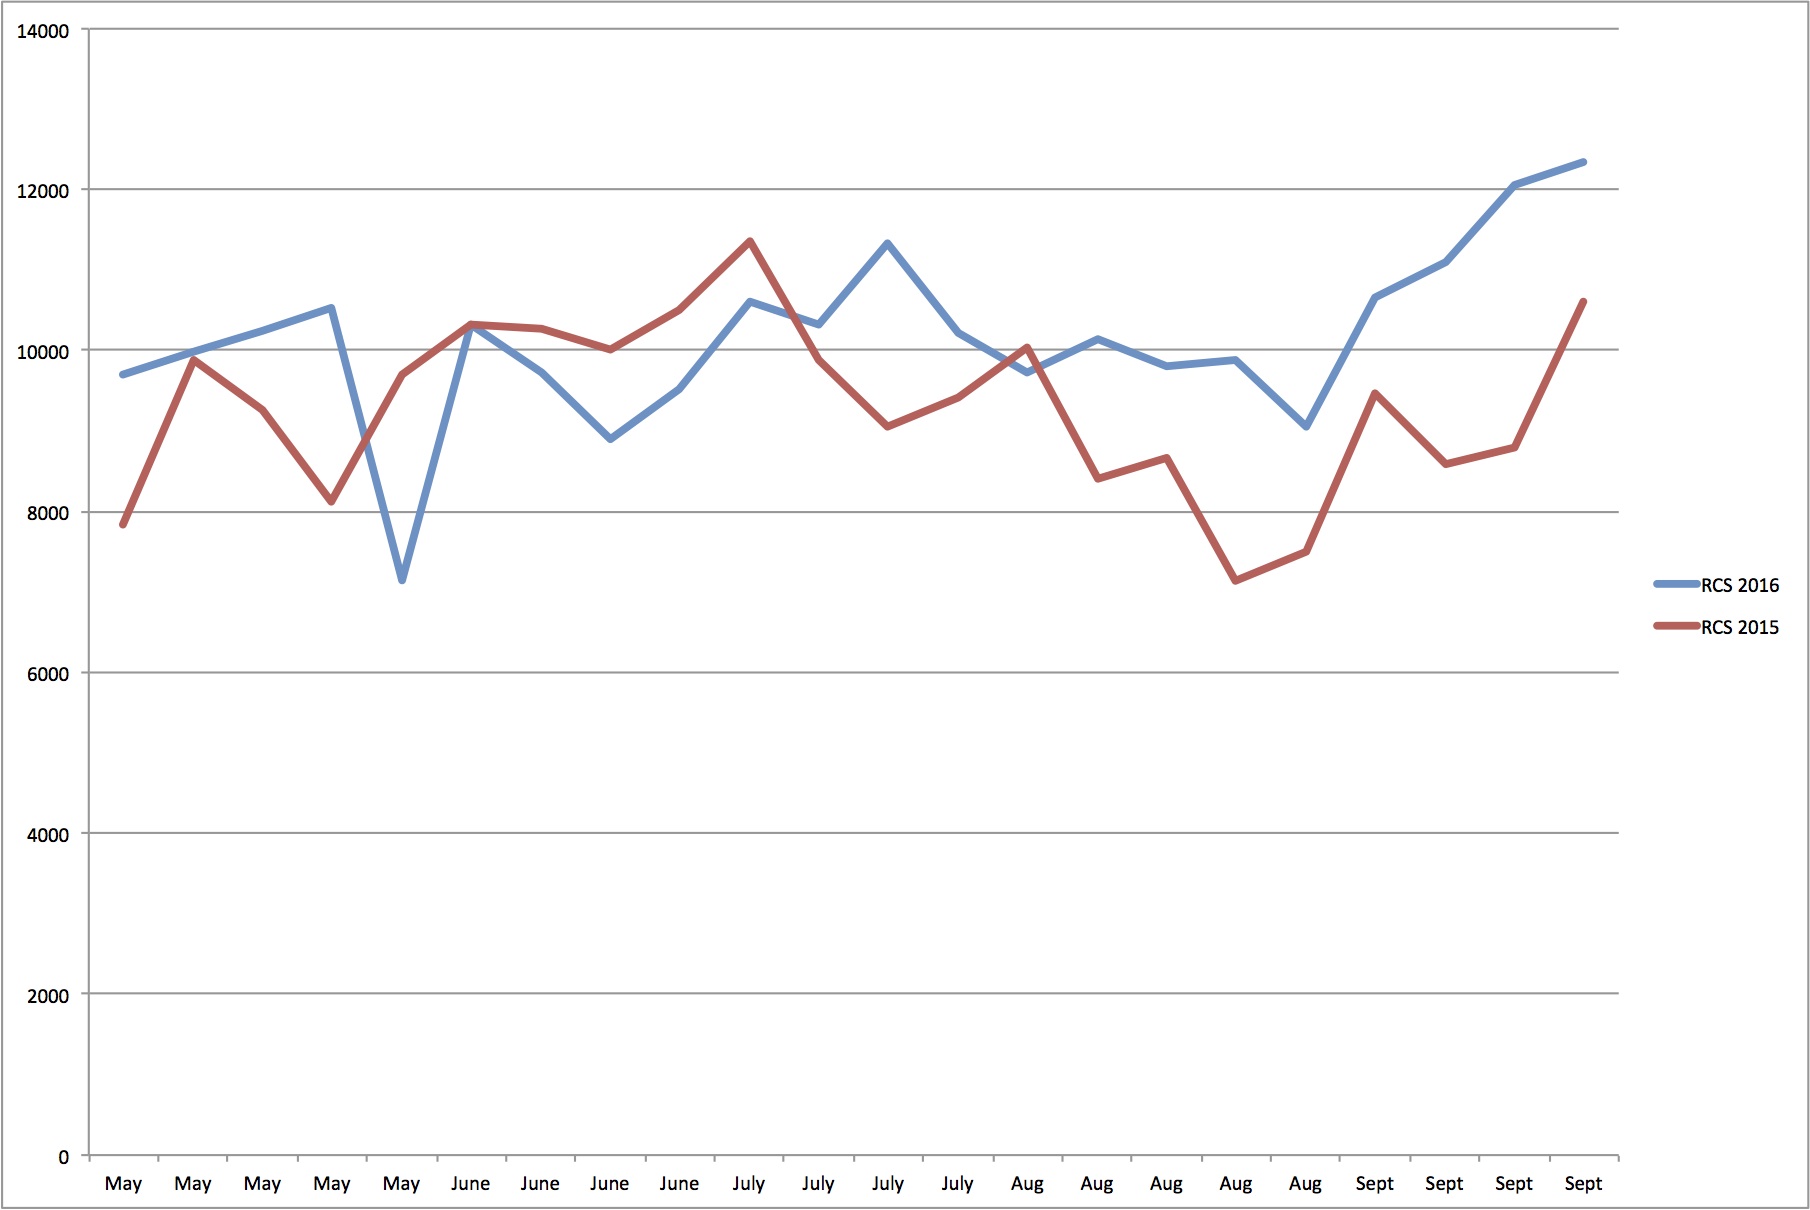
Weekly Counts May – September 2016 compared with last year
Figure 1 provides a comparison of the weekly counts on Royal College Street between this year (2016 ) and last year (2015) during the months of May – September.
These comparisons show a large increase (about 20% on average) every week since mid July, with one exception around 1st August.
The start of this increase does coincide with the opening of the Royal College Street northern extension.
The Pancras Road counter started to operate on 22nd September 2015 and was then out of action between 18th June 2016 and 19th September 2016. Therefore, unfortunately, we have only a few days of data that can be compared, ruling out weekly comparisons.
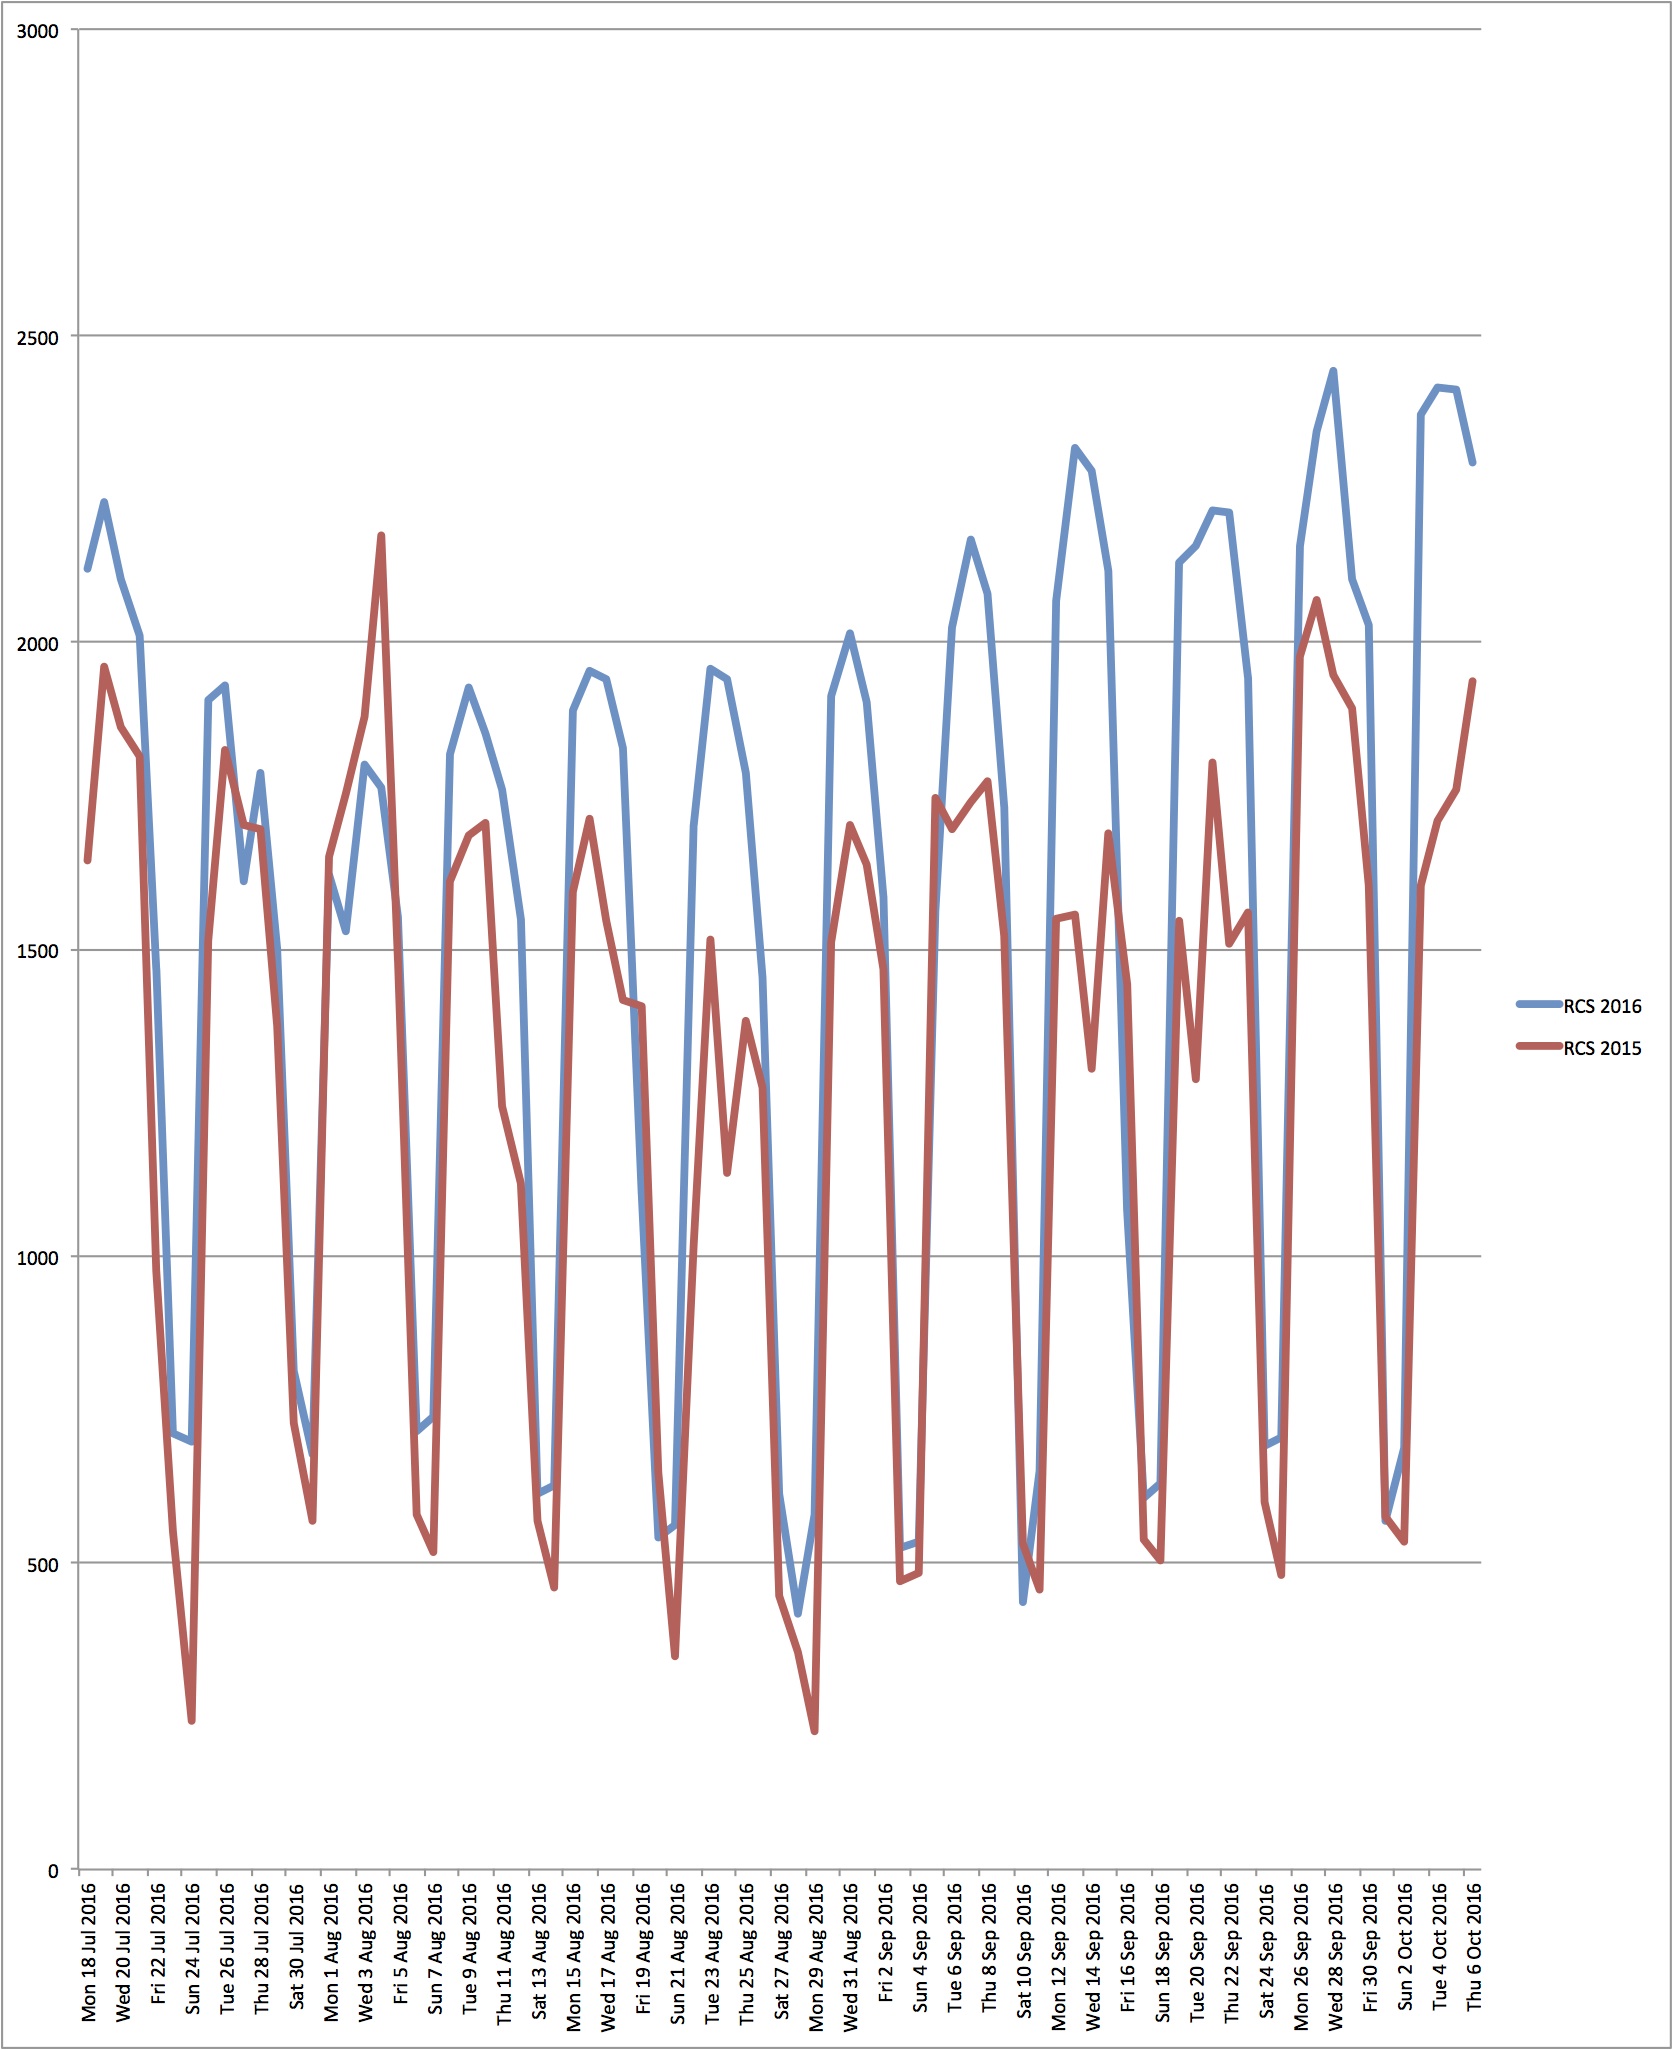
Daily Counts July – October 2016 compared with last year
The comparisons of the daily counts during the months of mid July – September between this year (2016 ) and last year (2015) for Royal College Street are displayed in Figure 2. We can see that since early in August, this year’s daily totals are significantly higher than last year’s.
The increase in daily counts has became even more marked since early September with 17 of the last 20 weekdays totalling over 2000 per day, whereas this happened on only 11 days in the year ending 31st April 2016.
The maximum daily count was 2444 on Wed 28th September – although high, this doesn’t reach the maximum daily total of 2627 on Thursday 9th July 2015 when there was a 24-hour tube strike.

Figure 3 shows a comparison of this year’s and last year’s daily counts in Pancras Road during the few days since 22nd September when a comparison is possible.
Again we have an astonishing increase on weekdays. The maximum weekday count is 2341.
Northbound vs Southbound
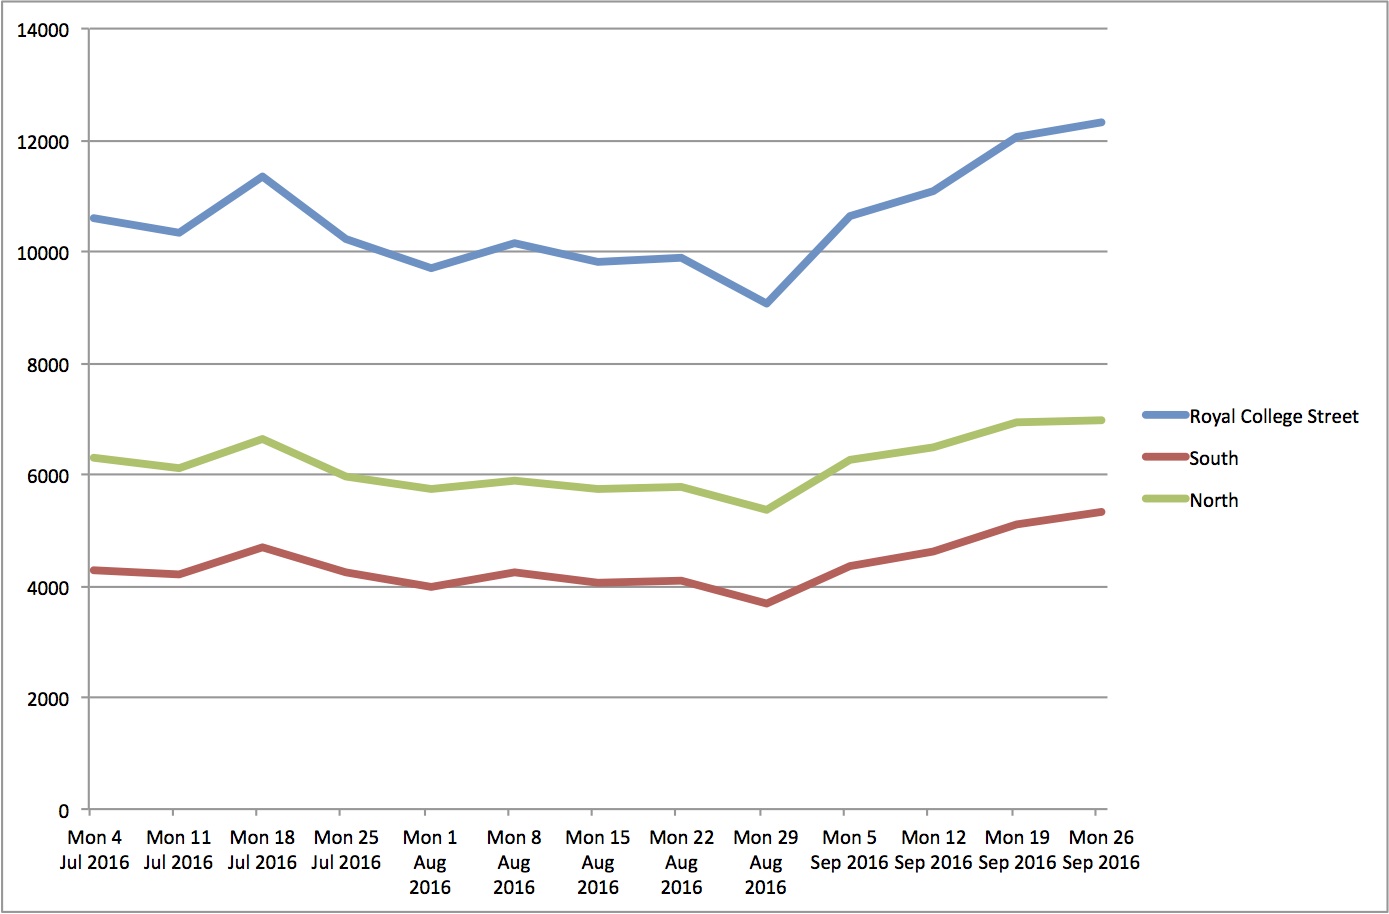
During the first two years of operation until the beginning of May 2016, the number of northbound cycles was almost twice the number going southbound (about 63% of the total). Has this changed since July?
Figure 4 shows the north and southbound counts on Royal College Street and at a glance, things have not changed much. But a closer analysis of the count data shows that northbound now have about 58% of the total.
Tentative conclusion
It seems likely that the opening of the Royal College Street northern extension has attracted a substantial number of new users in a similar way to the Tavistock Place trial. The predominance of northbound cyclists is due historically to the fact that the nearest northbound alternative is Camden High Street. Many southbound cyclists still use St Pancras Way and Camden Street as alternatives to Royal College Street.
At the junction of St Pancras Way and Royal College Street, some southbound cyclists still take the former. It will be interesting to see whether, once the route is signed, more people travelling south will take advantage of it.
Previous Reports
Cycle counts in Royal College Street: comparison of first and second years
Royal College Street Cycle Counter: summary of first year’s data