The first cycle counter was installed in Royal College Street (RCS) in mid-April 2014. Each year, we have reported on the counts, comparing each year with the ones that went before it.
Five years of data from the original Royal College Street Counter
Royal College Street – annual totals
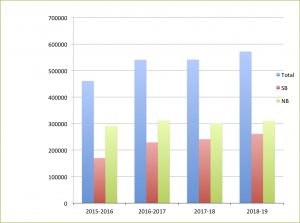
Figure 1: Royal College Street: comparison of five years’ annual data. Journeys for each year are counted from the beginning of May in that year to the end of April in the next. Click to enlarge
Figure 1 compares the annual counts for the first five years (NB: northbound and SB: southbound).
After a significant annual increase, possibly associated with the opening of the northern extension of the track to Kentish Town in October 2016 the annual totals remained steady during 2016-17 and 2017-18 but during the twelve months from 1st May 2018 to 30th April 2019, the total number of cycles counted was 571743, a 6% increase from the previous year’s total of 541376 and a 30% increase since the start of counting in 2014. We know from our last year’s report that the low numbers in February and March 2018 would have depressed the counts for 2017-2018. We will look at the monthly counts to see whether we can identify when the recent increase started.
The proportion of southbound cycles in 2018-2019 is 46% compared to 37% in the first year. This proportion has gradually increased since the RCS northern extension made it possible to cycle southbound all along RCS. (The alternative is to use St Pancras Way instead of RCS).
Royal College Street – monthly totals
Has there been an increase and when did it occur?
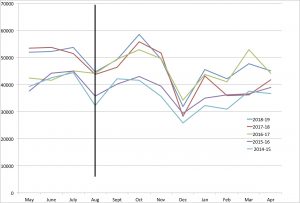
Figure 2 compares the monthly counts for the five years since the counter was installed. The blue line represents the period 1st May 2018 – 30th April 2019. The red line represents the previous year (2017-18) and the green line the year before that (2016-17). The most recent year (blue line) follows quite closely the higher of the red and green – i.e lines for the two previous years. In more detail, a considerable increase started in August 2016 (August is indicated by the black vertical line), when the green line (2016-2017) rose well above the bottom two lines (purple and turquoise) and stayed that way until the end of April 2017. The sequence of time continues on the red line in May 2017 and maintains its position well above the lines for the earlier years until July 2017 when it levels with the top two lines (blue and green). Over the period described (August 2016 to July 2017), there was an average monthly increase of about 23% over the previous year (August 2015 to July 2016).
The presence of this increase is hidden in the annual counts because the red line suffers a significant drop in February and March 2018 which could be attributed to the weather†. The red line is showing recovery by the end of April 2018. The sequence of time continues as the blue line in May 2018, after which it shows no more increase over the corresponding values in two previous earlier years. Our tentative conclusion is that the increase occurred in about August 2016 and since then that level has been maintained.
Monthly patterns based on figures from the last two years
The monthly totals seem to follow a pattern with over 50K in May, June and July followed by a drop in August – September and then a peak of 55-58K in October. (The all-time maximum monthly total was 58591 in October 2018.) The lowest counts are over the Christmas period. They then build up again in the New Year with a slight drop in February.
†. According to the NW3 Weather Station there was very cold weather at the end of February 2018 and 50% more rainfall than average in March 2018. See also our discussion of this issue in Summary of 4 years’ cycle counts in Royal College Street
Royal College Street – weekly totals
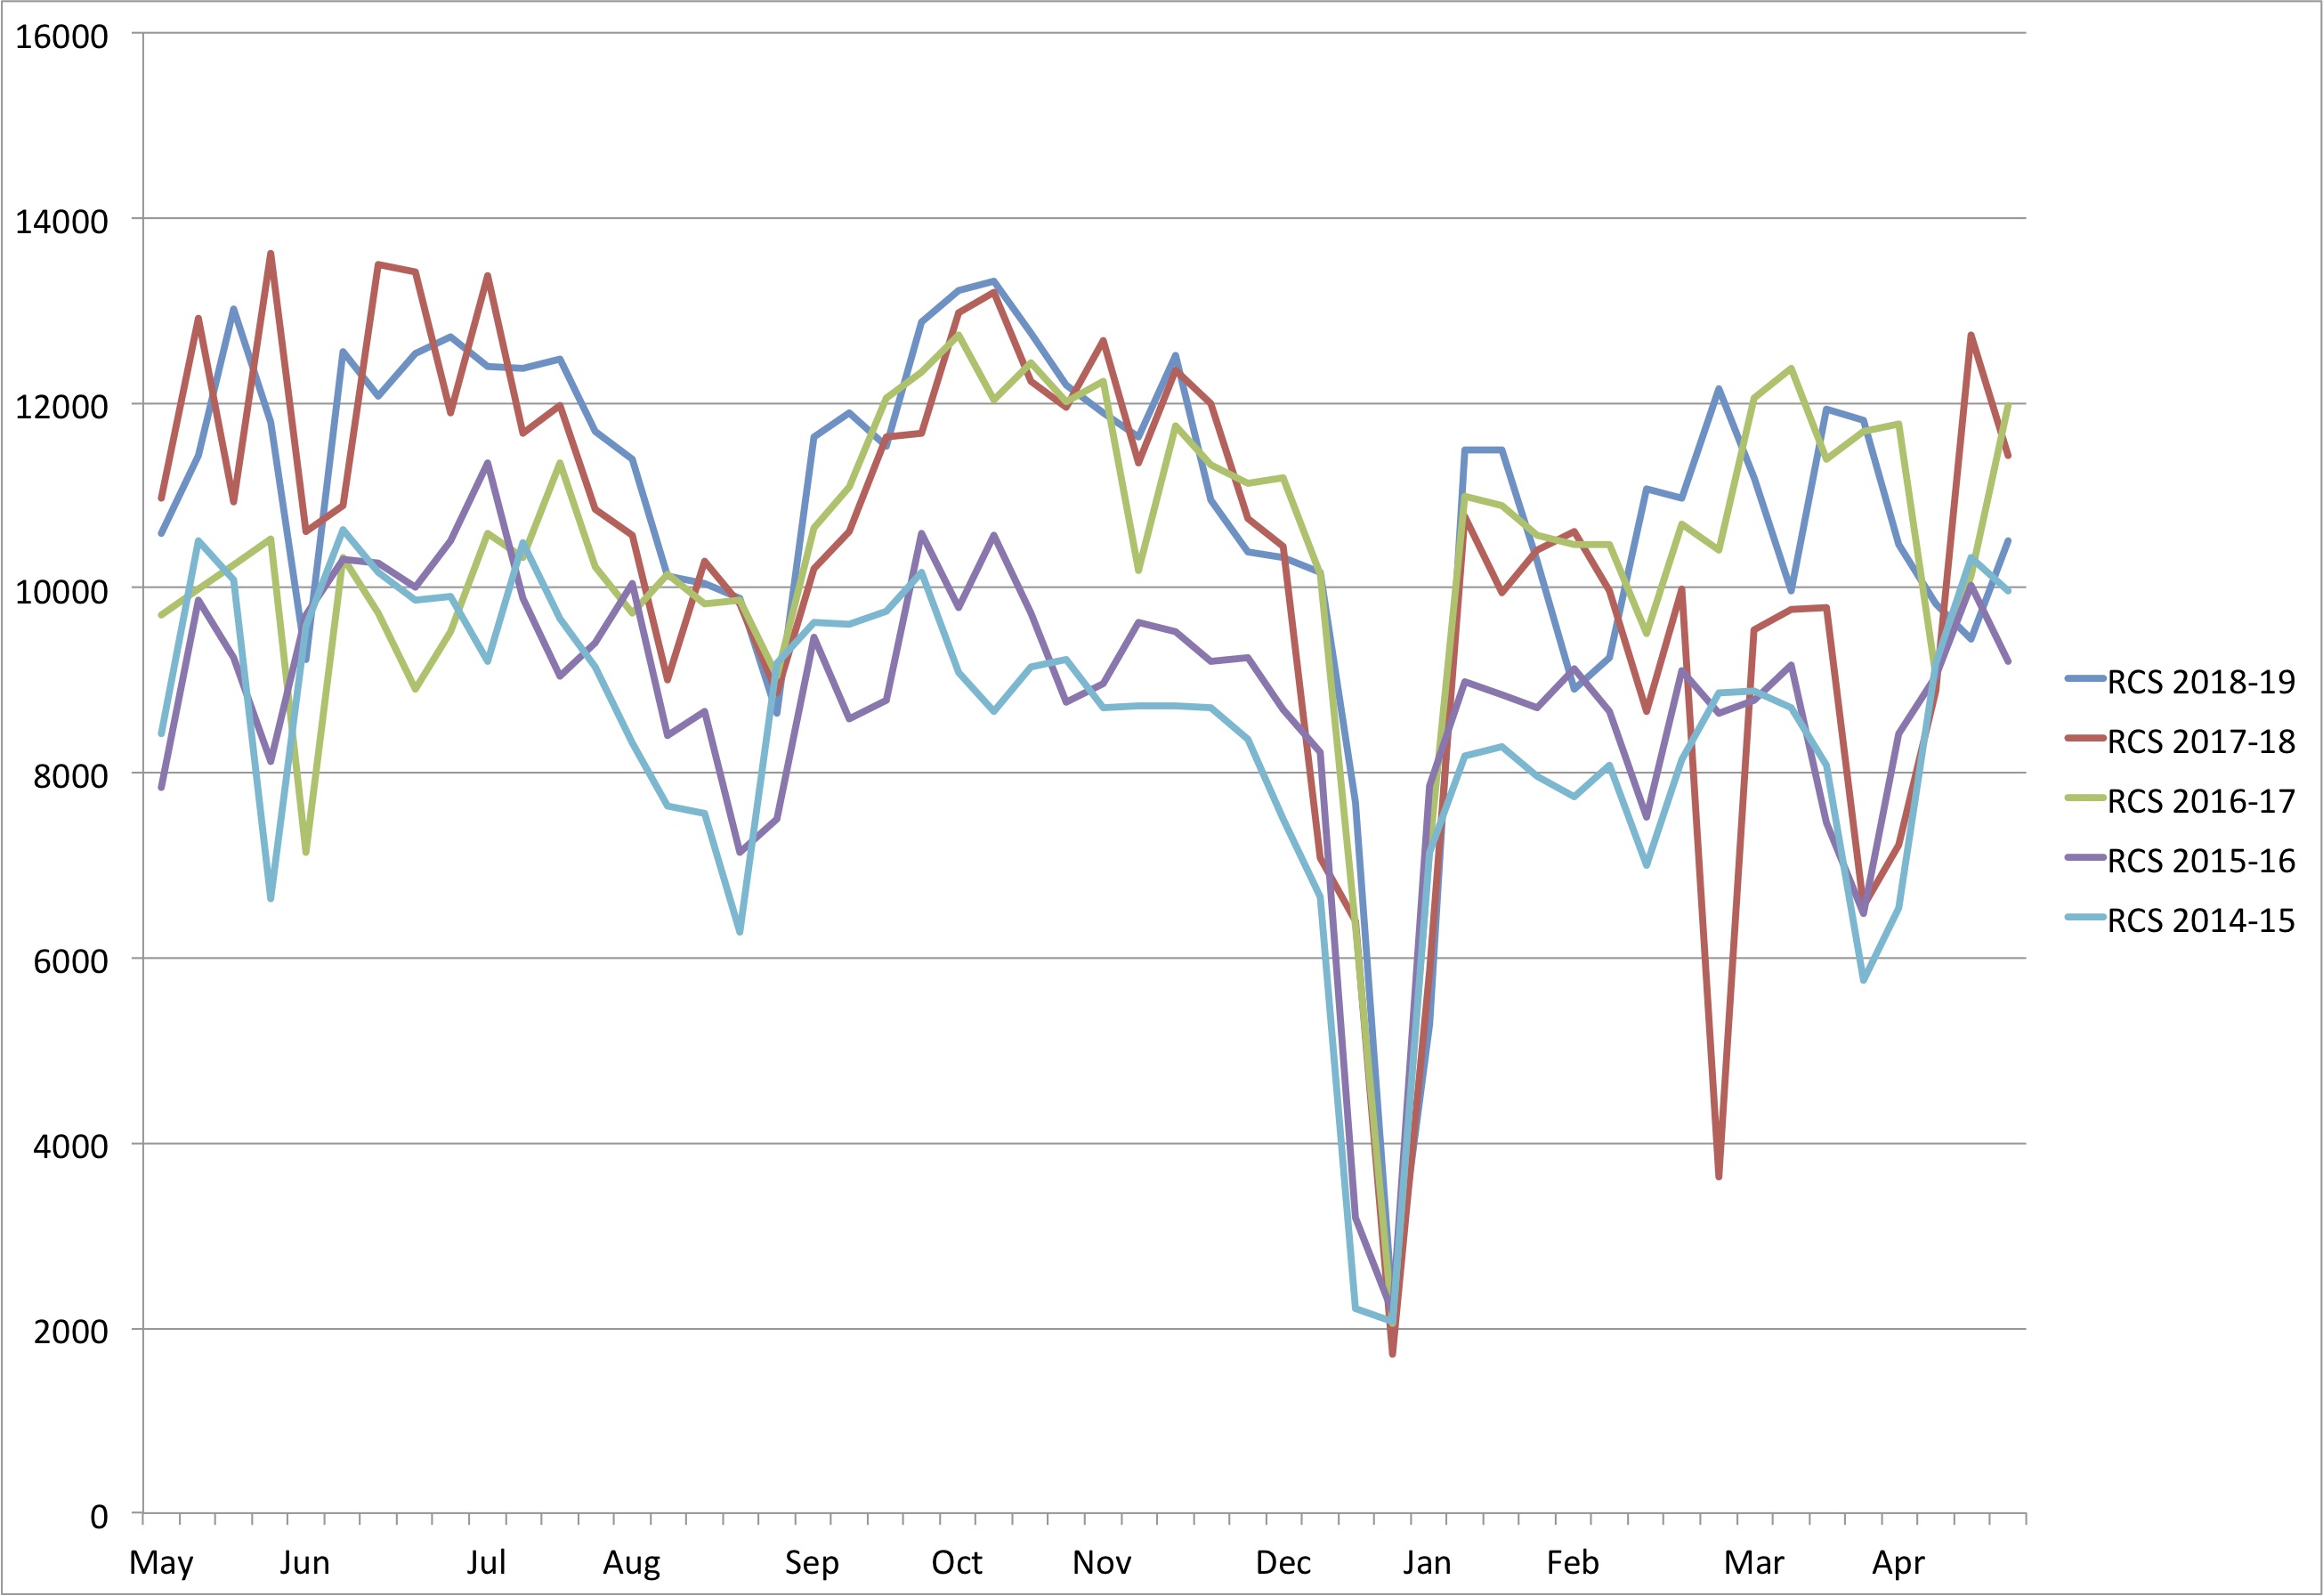
Figure 3 compares counts over the entire week including weekends over the last five years. As in Figure 2, the blue line represents the period 1st May 2018 – 30th April 2019 while the red and green lines represent the previous two years. The maximum weekly total in the last year is 13311 (first week in October 2018) while the all-time weekly maximum was 13610 in the last week of May 2017.
During the last year (1st May 2018 – 30th April 2019):
- the weekly total was over 12,000 in fifteen weeks, including those starting 4th June to 10th July and those starting 24th September to 22nd October.
- During the last year (1st May 2018 – 30th April 2019), the weekly total was below 8000 in only three weeks – all of them over the Christmas – New Year’s Day period.
- the average weekly total was almost 11,000 journeys.
Royal College Street –1st May 2018 – 30th April 2019. Weekday counts regularly exceed 2000 cycles

Figure 5. RCS Comparisons of daily averages between 30th April 2018 and 29th April 2019. Click to enlarge
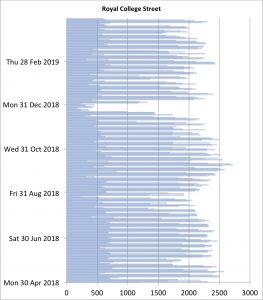
Figure 4 shows daily counts from 1st May 2017 to 30th April 2018.
- On eleven days, the count exceeded 2500 and on two of these days, the count exceeded 2600.
- These were on Tuesday 9th October and Wednesday 10th June 2018 with the then maximum all-time daily count of 2729, which has now been exceeded on 21st May this year.
- The average weekday count is 1955 but some days are more popular than others.
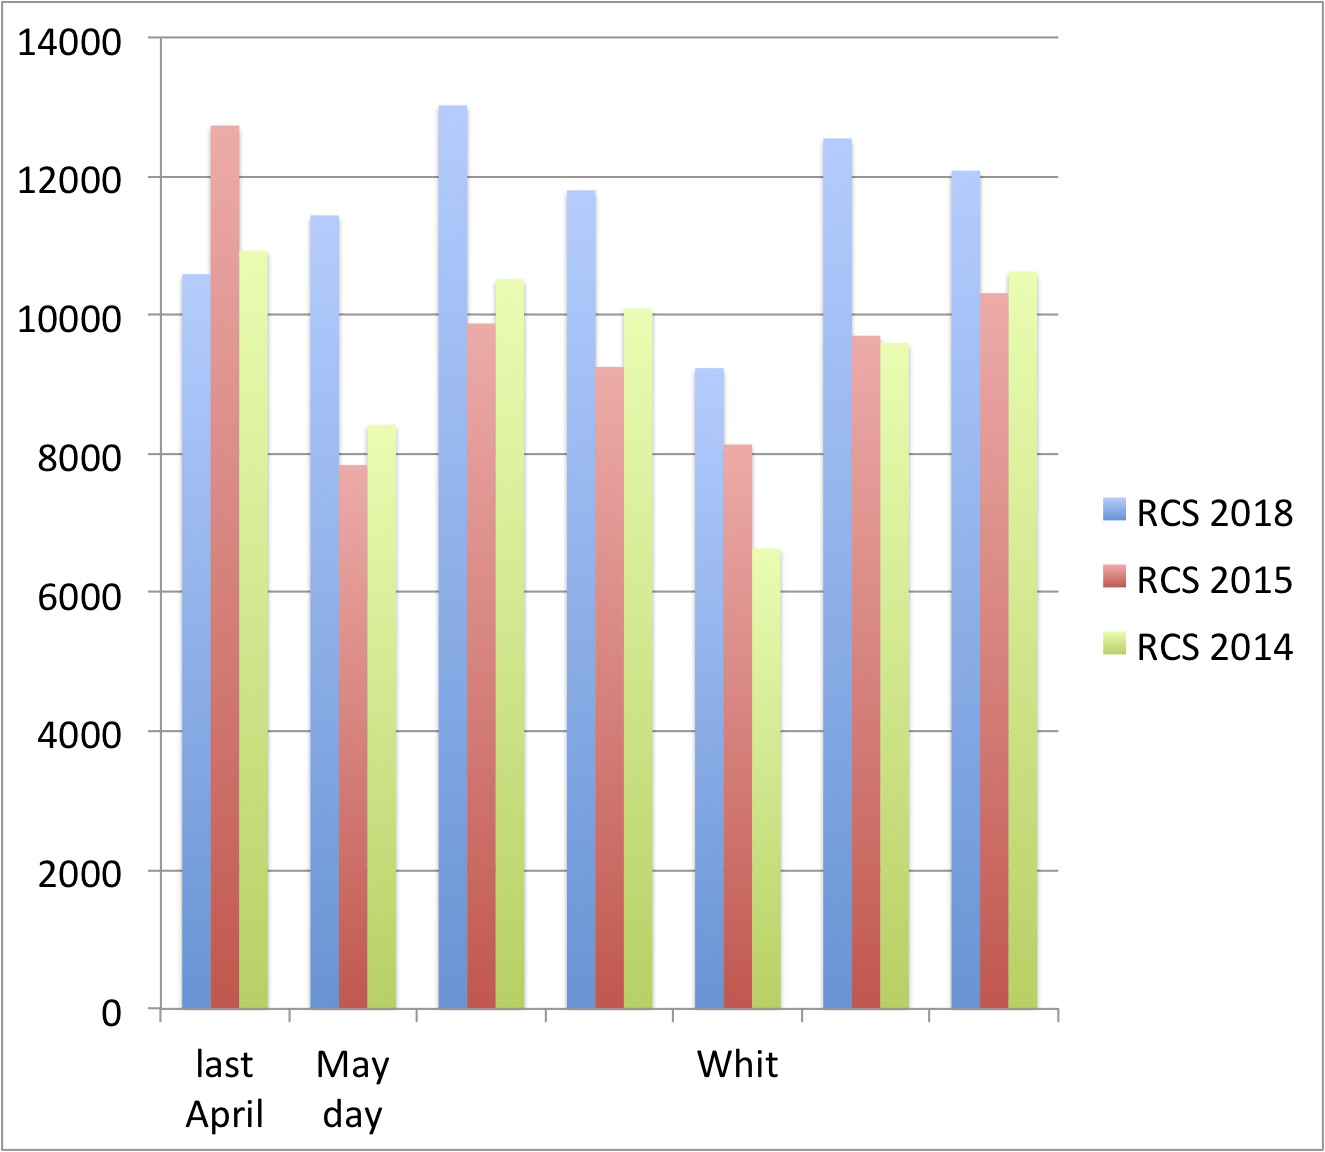
- Figure 5 shows the average counts for each weekday. Tuesdays are the most popular, with an average of 2139 journeys. Wednesdays and Thursdays are not far behind. But Friday’s average is only 1613.
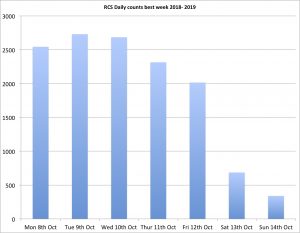
- As mentioned above, the week with the highest count (13311) starts on Monday 8th October. Figure 6 shows the counts for each day in that week, e.g. Tuesday has 2729 while Wednesday and Thursday have 2684 and 2314 respectively. Even Friday with 2015 is well above the average.
- The only weekdays with values below 1000 were on the two May and the August Bank Holiday as well as over the Christmas and New Year period.
May Bank Holidays
We wondered whether having two Bank Holidays in May would affect the monthly totals.
The May Bank Holidays occur on the first and last Mondays in May but it’s hard to line them up on a chart because they are sometimes three and sometimes four weeks apart. Figures 6 and 7 illustrate the two cases and show the dips that occur in the weeks of the early May bank holiday and Whit Monday. This could have a general effect of depressing the counts for the month of May but in fact, the May counts are generally similar to those in June and July.
Do the other cycle counters show the same trends and can they tell us anything about routes?

Figure 8. Shows in blue the route of Q1 north. The red stars show the locations of three cycle counters.
Figure 8 shows the locations of the three cycle counters in the context of the extension of the route on Royal College Street and Pancras Road onto Midland Road and Judd Street.
In this section, we will use the most recent data we have – going up to the end of July 2019.

Figure 9: Chart produced directly on the Ecovision website which records the data from the three counters,
Figure 9 shows the original Royal College Street counter in light blue, the Royal College Street north counter in very dark blue (black?) and the Pancras Road counter in green. See Figure 12 for the locations of these counters. Notes about the values that appear to deviate from the normal pattern:
- The Royal College Street counter (light blue line): the work on replacing the planters started on 8th July with the effect that northbound cycles used the road and only southbound cycles were counted. Work moved to the southbound track on 30th August but the counts on the northbound track did not pick up. We have observed and reported to Camden that the number on the display fails to increase when people cycle past on the northbound track and that daily northbound counts have been zero on every day since 16th July (up to 5th August so far).
- The Pancras Road counter (green line) has been unreliable since its installation in September 2015. As can be observed from Figure 9, values were zero between 13th February and 22nd March and dropped almost to zero on June 3rd. Camden has had discussions with Traffic Technology (the providers) who have ‘fixed this counter’; but they have not addressed the anomalous values which are supplied from time to time e.g. in April and May (we have checked that it’s not a matter of the drop out of either northbound or southbound counts).
Comparison of the last year’s results from the two counters on RCS
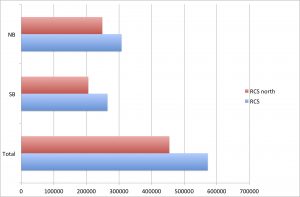
Figure 10 compares northbound, southbound and total annual counts ( 9th July 2018-7th July 2019) at the two counters in Royal College Street: the total number of journeys past the northern counter is about 80% of the number of journeys past the original counter in Royal College Street, with a very slightly higher proportion northbound. As we mentioned in last year’s report, the majority of users continue on their north- or southbound route on Royal College Street when crossing Camden Road, while people from the east join the route at Georgiana Street and people from the west joint at Pratt Street.
On the northern counter, the proportion of northbound cycles is 55% compared with 54% in RCS.
Comparison of the last year’s results from the Pancras Road counter and the original RCS counter
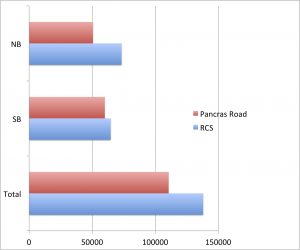
Figure 11 compares northbound, southbound and total counts at the counters in Royal College Street and in Pancras Road. These comparisons are made on dates when both counters are providing sensible data (1st January-2nd February, 9th May-31st May and 11th June – 7th July): the total number of journeys past the Pancras Road counter is about 80% of the number of journeys past the original counter in Royal College Street, but for southbound cycles figures are more similar (with Pancras Road count 92% being of the one in RCS).
Some points:
- over half of the data in Figure 11 was collected after the opening of the Judd Midland scheme in May;
- before that the Somerstown route provided the only northbound and the only safe southbound crossing over Euston Road;
- The route towards Goodsway is accessed via Pancras Road;
- Some people still use St Pancras Way southbound.
- On the Pancras Road counter, the proportion of southbound cycles is 54%.
Opening of Midland Road – Judd Street route in May 2019
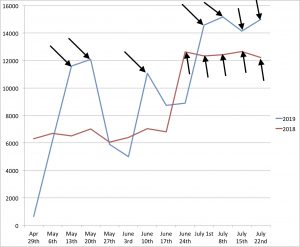
Figure 12. Pancras Road weekly counts May – July 2018 and 2019 with arrows indicating ‘trusted’ values. Click to enlarge
The daily cycle counts are displayed on this page of this website and the count for RCS is also on the Home page, enabling us to keep an eye on them. On Tuesday 21st May, we noticed that the cycle counts on Pancras Road and Royal College Street were 2837 and 2747 respectively, both numbers exceeding the maximum all-time daily count of 2729 on either of these counters (which was recorded in RCS in Oct 2018).
Have counts increased in Pancras Road since May?
Figure 12 shows a comparison of weekly journeys counted on Pancras Road from May – July in 2018 and in 2019. As the cycle counter on Pancras Road is inaccurate, we inspected the daily data with a view to rejecting any week in which a weekday value falls below 1000. With this criterion, we have decided to ‘trust’ the values marked with arrows in Figure 12. To carry out our comparison of ‘trusted’ values, we need arrows on both lines – which occurs only for the last four weeks.
If we allow ourselves to believe in the values from the brief period of four weeks starting on Monday 1st July 2019 then we do see a significant increase over the previous year. That is, the number of journeys on Pancras Road has increased,
In addition, the maximum weekly count was 15174 in the week starting 8th July with counts of over 14,000 in every week in July. Looking again, just before publishing this report we note that the weekday count in the week starting on 29th July was 15,464.
Has the new infrastructure has attracted new people to use the route?
Some of these new journeys on Pancras Road can be accounted for by people who have changed their route so as to use Midland Road instead of Ossulston Street.
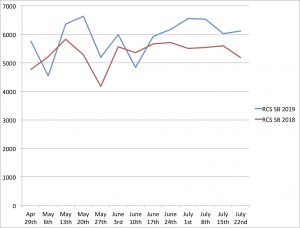
Due to work on replacing planters with kerbs, from 8th – 30th July, the Royal College Street counter has been unable to record northbound journeys. As we couldn’t see much of interest in comparing counts from May and June, we decided instead to look at the southbound counts. See Figure 13 which compares weekly counts of southbound journeys from May – July in 2019 and in 2018. It does appear to show an increase, which is on average 10% over the period. This could be interesting: as we noted above, the counts for the two years had been running roughly level from July 2018 to April 2019.
In addition, the weekly totals were 13838 and 140177 in the weeks starting on 20th May and on 1st July this summer, well above the previous maximum of 13311.
The maximum all-time daily count of 2729 (reported above) has now been exceeded by a count of 2926 on 21st May this year.
Summary
We have presented an analysis of five years of cycle counter data from the original counter in Royal College Street which was installed in April 2014. The first set of bullet points refer to counts up to the end of April 2019:
- over the five years, the annual data has increased by 30% and the proportion of southbound cycles is now up to 46% compared to 37% in the first year;
- between August 2016 and July 2017, there was an average monthly increase of about 23% over the previous year; after that, the monthly counts showed no significant increase between one year and the next;
- recent monthly totals follow a pattern with over 50K in May, June and July with a drop in August – September and then a peak of 55-58K in October. The lowest counts are over the Christmas and New Year’s day period. They then build up again in the New Year with a slight drop in February;
- the maximum weekly total in this period is 13311 (first week in October 2018);
- there is evidence of small dips in the weekly counts due to the bank holidays on the first and last Mondays in May. However, the monthly counts for May are generally similar to those in June and July;
- the average weekday count is 1955 but some days are more popular than others. Tuesdays are the most popular, with an average of 2139 journeys. Wednesdays and Thursdays are not far behind. But Friday’s average is only 1613.
- on eleven days, the daily count exceeded 2500 and on two of these days, the count exceeded 2600. These were on Tuesday 9th October and Wednesday 10th June 2018 with the then maximum all-time daily count of 2729.
We then looked to see what further information could be found from the other two counters – in Royal College Street north of Camden Road and Pancras Road:
- the Pancras Road counter has continued to be unreliable. For example, values were zero between 13th February and 22nd March and dropped almost to zero on June 3rd this. Unlikely (low) values are supplied from time to time;
- comparing annual data from 9th – July 2018 to 7th July 2019 from the two counters in Royal College Street shows that the total number of journeys past the northern counter is about 80% of the number of journeys past the original counter in Royal College Street, with a very slightly higher proportion northbound.
We tried to see whether we can see any effects from the provision of the new infrastructure (Midland – Judd):
- this calculation is severely impeded by the unreliability of the Pancras Road cycle counter;
- the brief period of four weeks starting on Monday 1st July 2019 shows a significant increase over the previous year. That is, there appears to be an increase in the number of journeys on Pancras Road;
- are these journeys just people moving from the Somerstown route or are they journeys involving new people?
- the comparison of weekly counts of southbound journeys on Royal College Street from May – July in 2019 and 2018 appears to show an increase, which is on average 10% over the period. This could be interesting!
Conclusion
We should carry out further studies of data from the original Royal College Street counter to find out whether the apparent increase in the number of journeys continues. The planter replacement is almost complete and people are now (7th August) able to cycle on both the northbound and southbound tracks on Royal College Street.
But the northbound count is still zero (6th August) and there is a desperate need to repair the damage so that it is possible to continue to collect evidence as to whether the new infrastructure is attracting new people to cycle.

