The first cycle counter was installed in Royal College Street in mid-April 2014. Each year, we have reported on the counts, comparing one year with the next.
Royal College Street – annual totals level off after three years rising
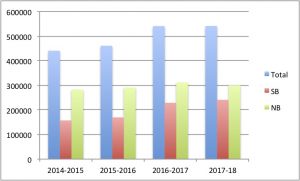
Figure 1: Royal College Street: comparison of counts four years’ annual data, May – Apr inclusive. Click to enlarge
Figure 1 compares the annual counts for the first four years (NB: northbound and SB: southbound).
For the twelve months from 1st May 2017 to 30th April 2018, the total number of cycles counted was 541376, only a tiny increase from the previous year’s total of 540892.
The northern extension of the track to Kentish Town opened in October 2016 and since then, the southbound counts have increased more than the northbound ones. The proportion of northbound cycles is now down to 55% compared to 63% in the first year, so the numbers are now more equal.
Data from two other counters could give some idea as to routes used for cycle journeys
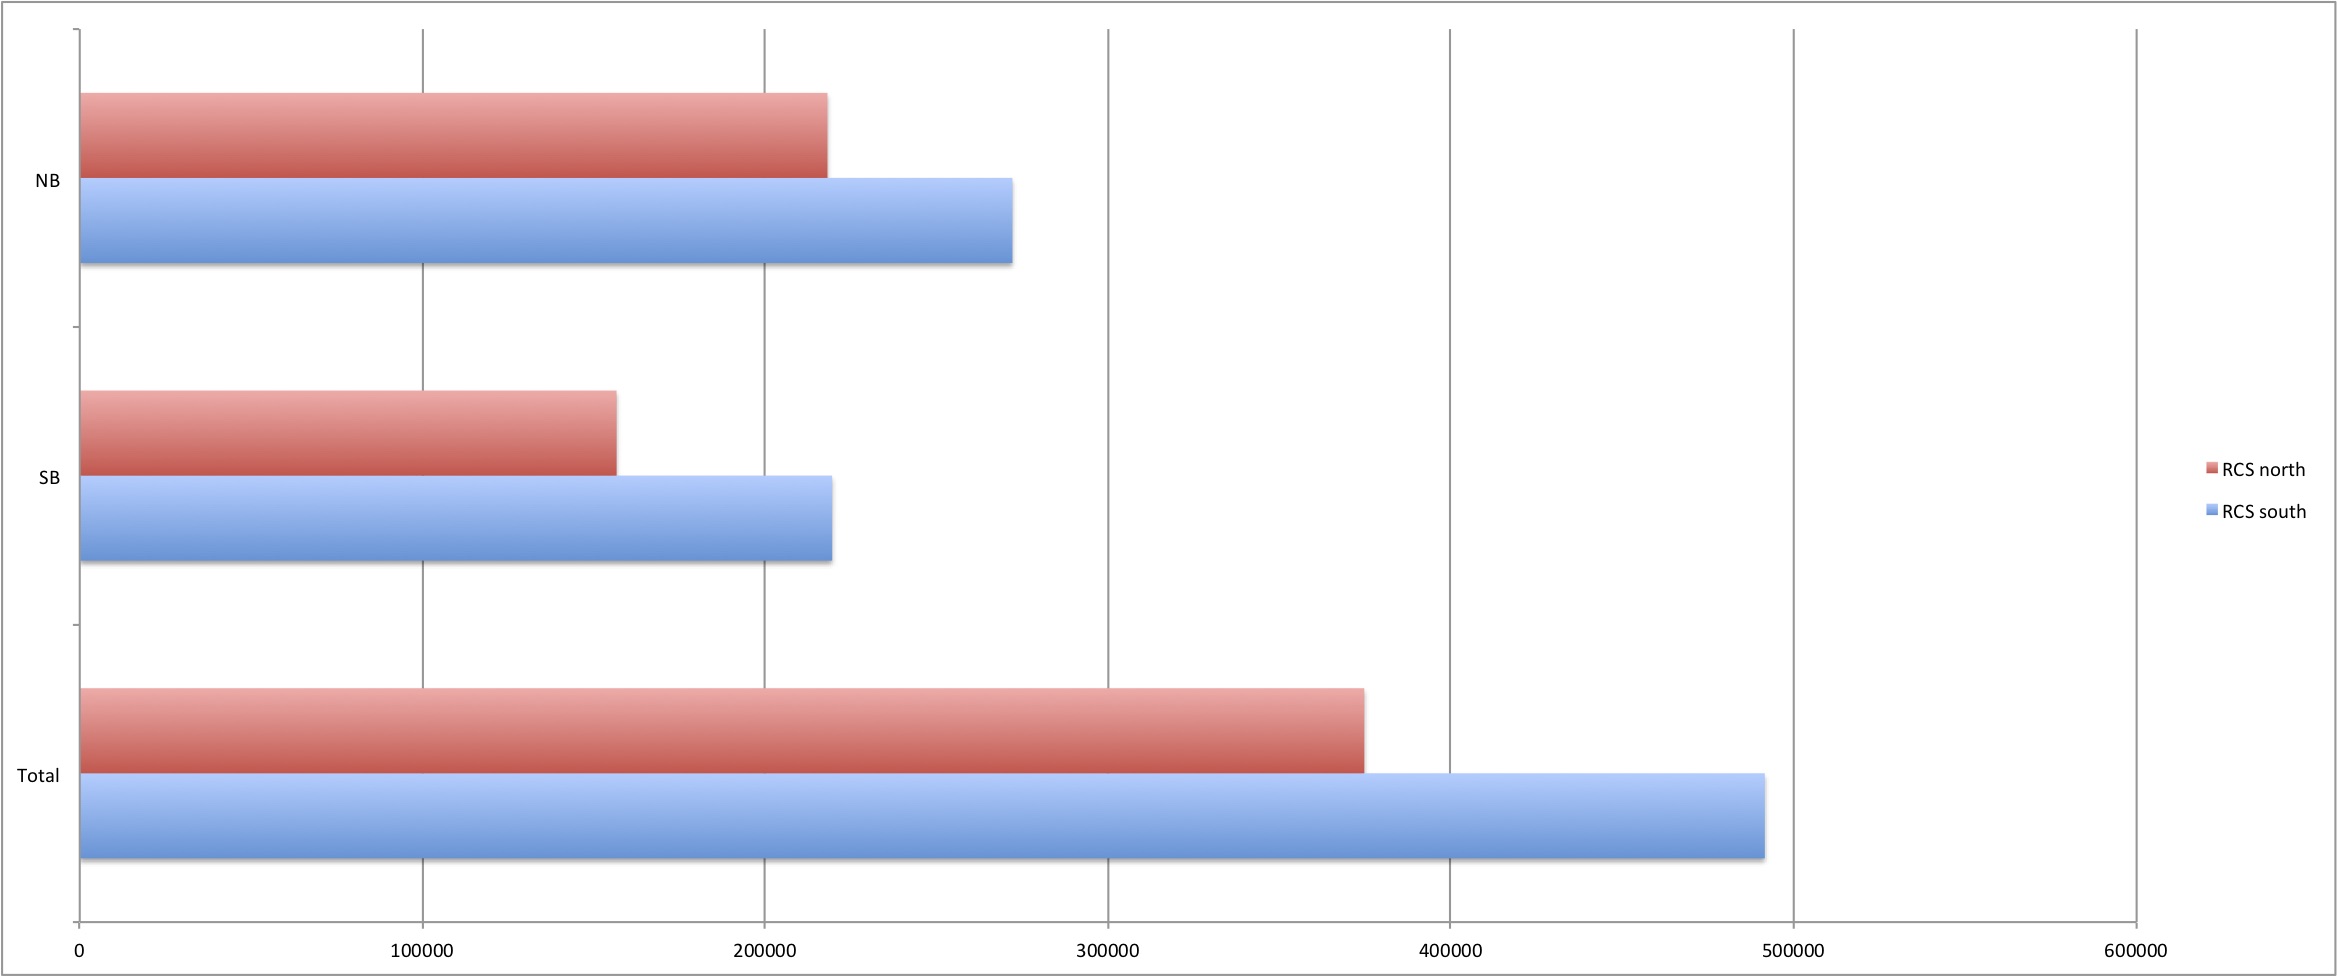
Figure 3: Comparison of counts at location 3 RCS-N (red) and location 1 RCS-S (blue) 14 Aug 2017 to 12 July 2018. Click to enlarge,
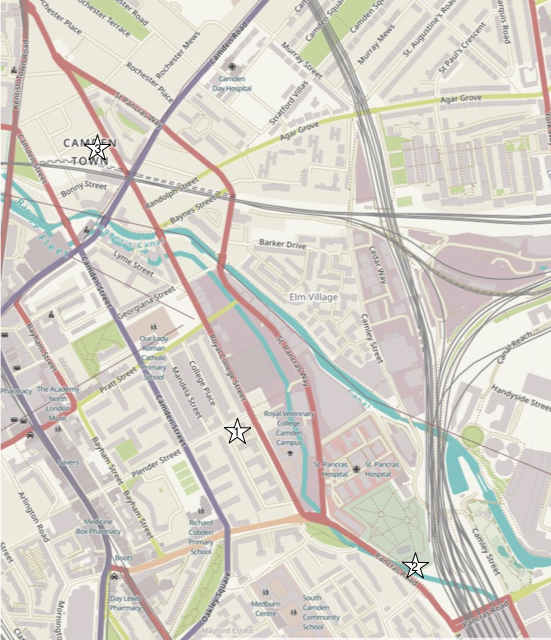
Figure 2 shows the locations of three cycle counters in this area. The data above is from the Royal College Street counter (“RCS-S)” #1 on the map). A second counter(#2) was installed in Pancras Road in September 2015 and a third (#3 ) in Royal College Street, north of Camden Road in August 2017 (“RCS-N”).
Figure 3 compares the data from counters 3 and 1 and shows that the total number of journeys past the northern counter is about 3/4 of the number of journeys past the original counter in Royal College Street, with a slightly higher proportion northbound. Occasional observations of the crossing over Camden Road indicate that the majority of users continue on their north- or southbound route on Royal College Street. Many people from the east join the route at Georgiana Street while others from the west joint at Pratt Street.
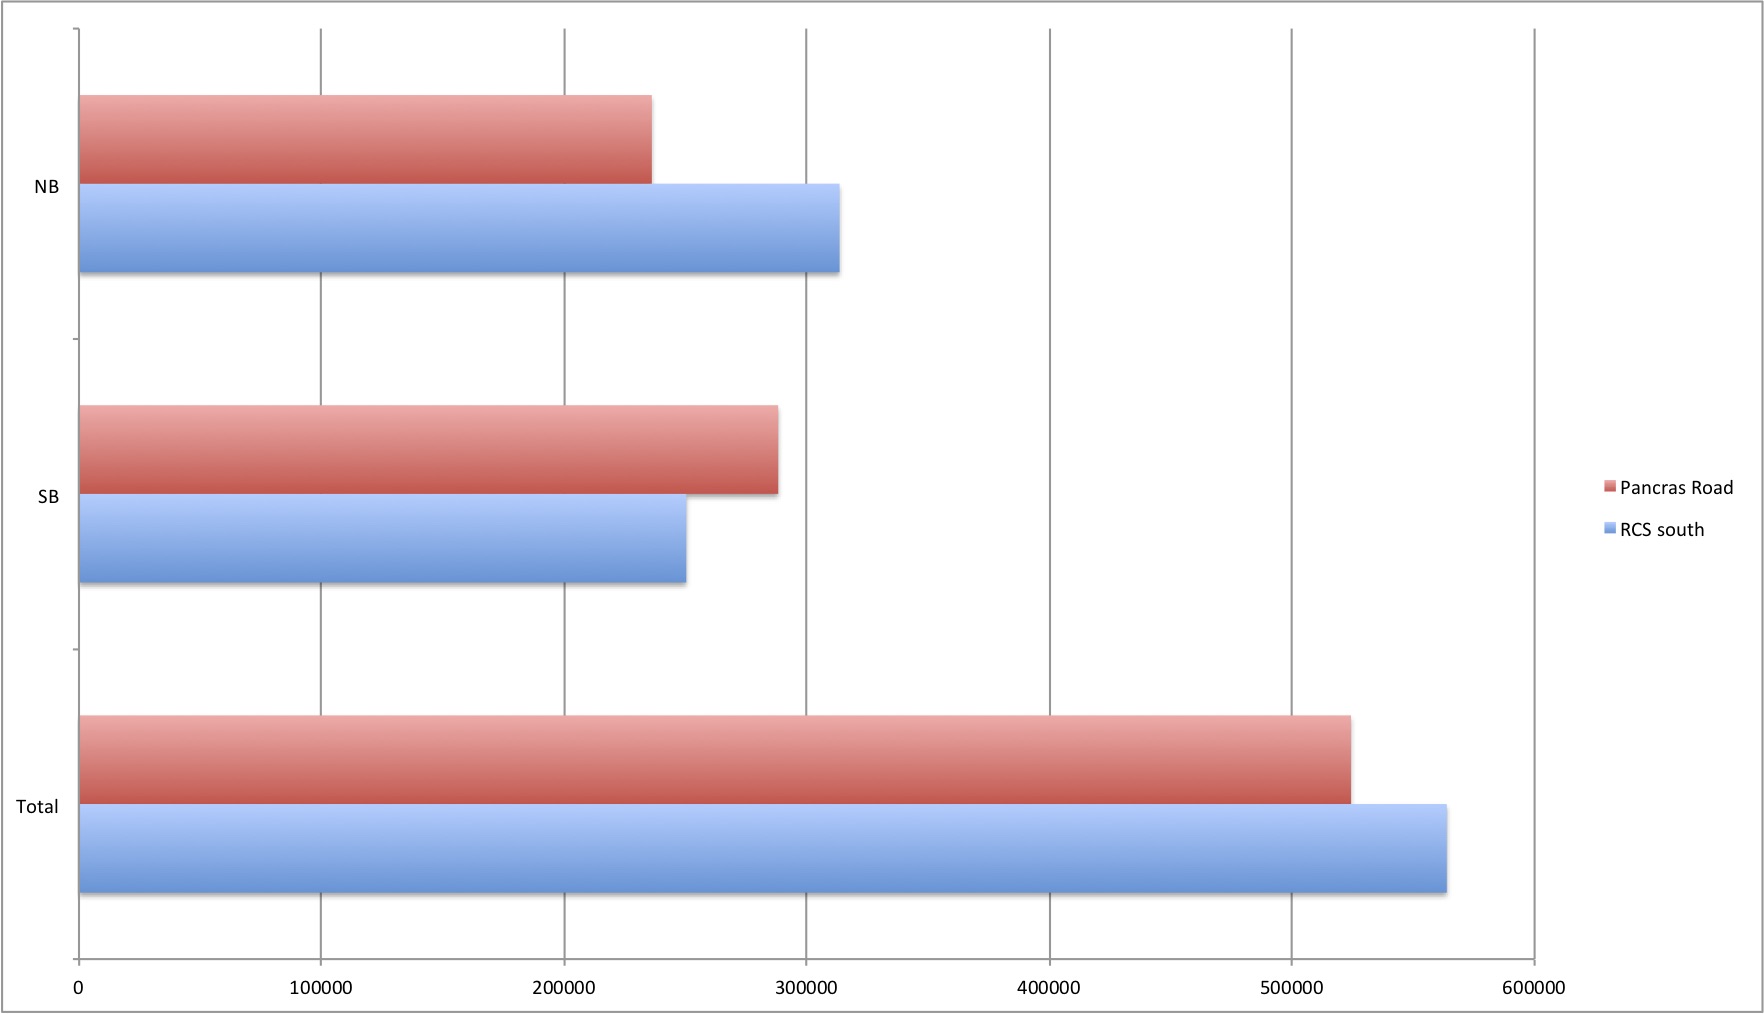
Figure 4: Comparison of location 2 (Pancras Road) (red) with location 1 RCS-S (blue) Feb 17 to Feb 18. First set of bars are northbound, second set southbound and third are totals. Click to enlarge,
Figure 4 compares the counts at counters 2 and 1 for the period 20 Feb 2017 to 19 Feb 2018 – we were forced to use this earlier period as counts on Pancras Road between mid-February and the end of June 2018 appear to be faulty.
Currently, Pancras Way is used to link to the east via Goodsway but when the two-way cycling infrastructure is built in Midland Road with the crossing over Euston Road to Judd Street, it is likely to become the much more popular.
Why are there more southbound journeys on Pancras Road than on RCS? The majority of people crossing southbound over Crowndale Road seem to head for the Somerstown route. But the numbers on Pancras Road will include people who use St Pancras Way from Kentish Town and from Agar Grove. This could explain why there are more southbound journeys on Pancras Road than on Royal College Street. But it means that more southbound cyclists use Pancras Way than RCS – not good.
Northbound journeys? Northbound journey numbers on Pancras Road are about 75% of those on RCS. But we know that many other journeys come via the Somerstown route. It would be interesting to find out more about what happens at the Crowndale Road junction.
Royal College Street – monthly totals
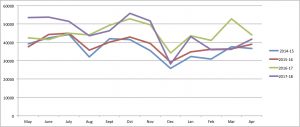
Figure 5 compares monthly counts for the first four years. The mauve line represents the period 1st May 2017 – 30th April 2018. The green line represents the previous year. The counts at the beginning of the fourth year (May to July 2017) show a considerable increase in numbers over the previous year (on average a 23% increase). This is a continuation of the increase observed after the opening of the RCS northern extension in mid-July 2016. After a level period in the winter, the figures for February and March this year dropped well below those for last year.
The big difference in February and March could be attributed to the weather: according to the NW3 Weather Station there was very cold weather at the end of February and 50% more rainfall than average in March. By April, the 2018 count was approaching that of the year before.
Royal College Street – weekly data show continuing increases up to last July, then a leveling followed by a drop in February and March during bad weather
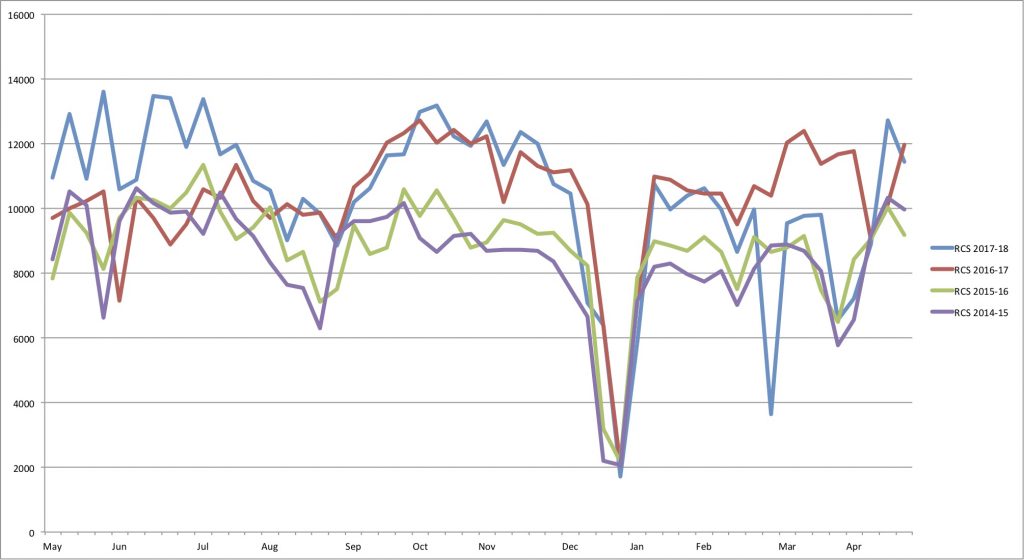
Figure 6 compares counts over the entire week including weekends with the blue line representing the period 1st May 2017 – 30th April 2018 and the red line the previous year. During May, June and July 2017, the weekly counts continue to exceed those of the previous years, with an all-time weekly maximum of 13610 in the last week of May 2017.
From September 2017 until February 2018, the weekly counts for the two years are almost identical.
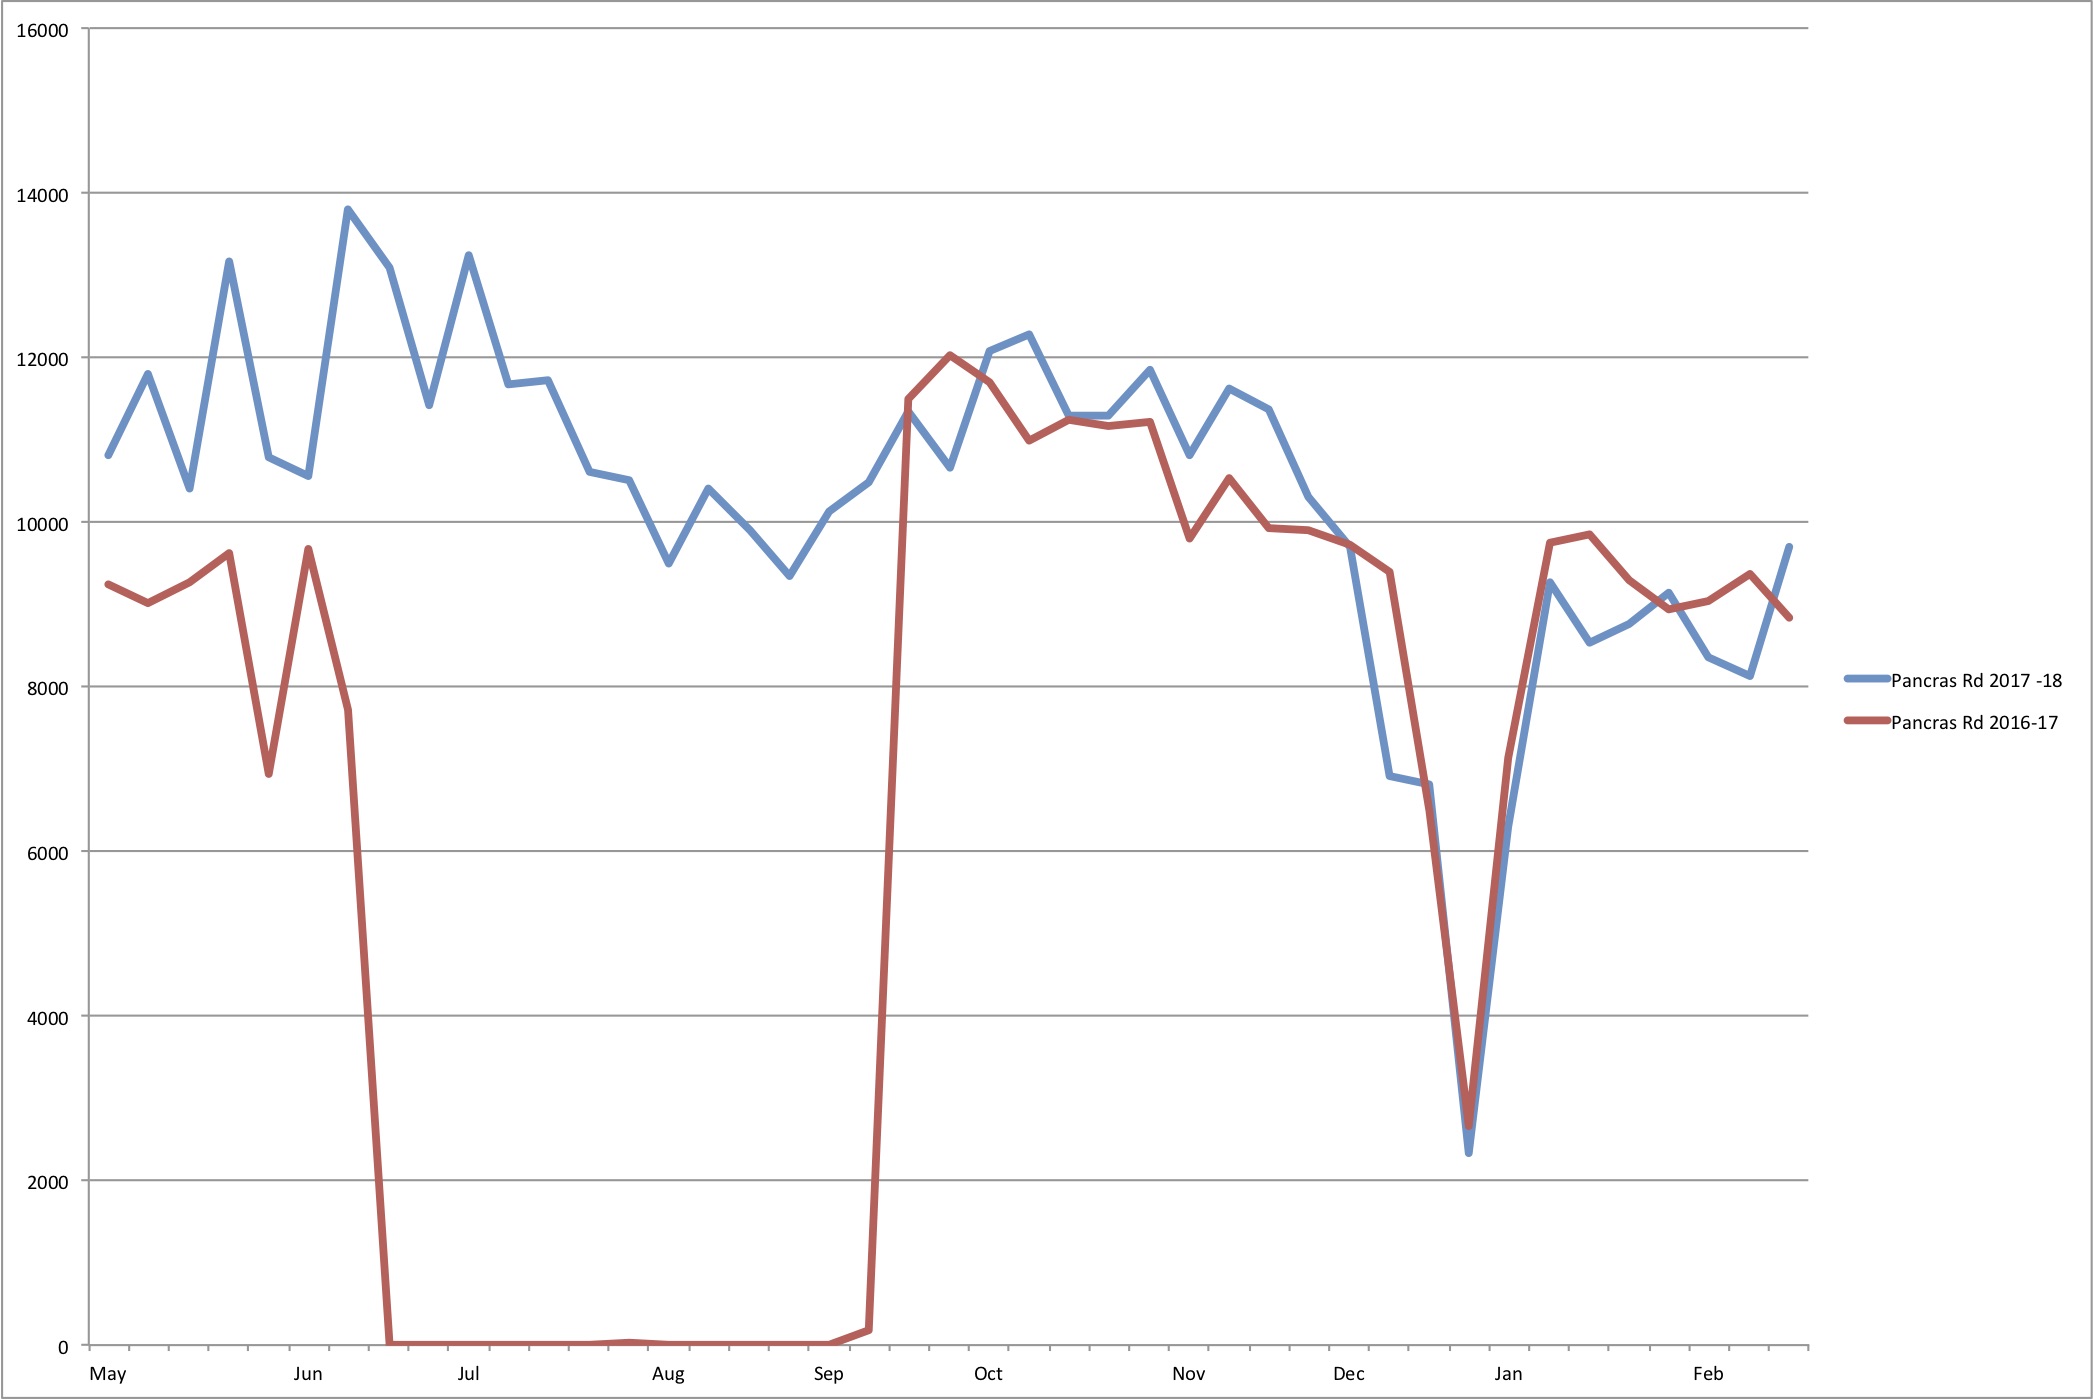
Does the Pancras Road data confirm the leveling off? Figure 7 compares counts over the entire week with the blue line representing the period 1st May 2017 – 19th Feb 2018 and the red line the previous year. (The data from March to June 2018 appears to be implausible and we feel unable to use it). In addition, the data in our comparison is incomplete because this counter was out of service from 18th June 2016- 18th September 2016. However, we can see the same levelling off from last September onwards.
Royal College Street dips: As usual, counts dropped in August and again around Christmas and New Year with an all-time minimum of 1717 cycle journeys in the week starting Monday 25th December 2017.
The weekly figures allow us to look more closely at the above drop in numbers during February and March 2018. We will look at the lowest weekly counts (i.e. those below 9000):
- In the week starting Monday 26th February, only 3634 cycle journeys were counted. Four weekdays days recorded maximum temperatures below zero.
- In the week starting Monday 26th March, 6565 cycle journeys were counted. The Wednesday and Friday saw 10.6 mm and 9.8 mm rainfall respectively with over 3 mm on Tuesday and Thursday. The Friday was Good Friday.
- In the week starting Monday 2nd April (Easter Monday), 7226 cycle journeys were counted.
- In the week starting Monday 12th February, 8674 cycle journeys were counted. It rained on three days, the highest rainfall being 6.6mm on Wednesday.
Royal College Street –1st May 2017 – 30th April 2018. Weekday counts regularly exceed 2000 cycles
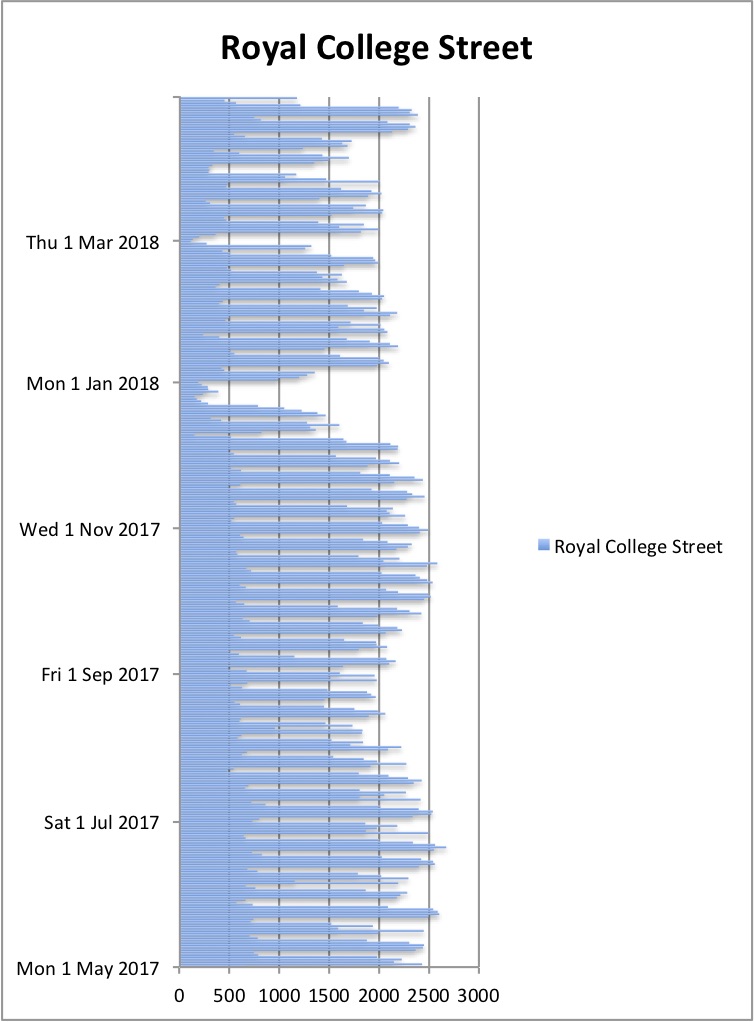
This website displays yesterday’s counts on the Home page. In spite of some poor figures in March, we have continued to notice that weekday counts are regularly exceeding 2000. This occurred on 120 weekdays in the period studied.
Figure 8 shows daily counts from 1st May 2017 to 30th April 2018.
On thirteen days, the count exceeded 2500 and on two of these days, the count exceeded 2600. These were on Tuesday 23rd May and Tuesday 20th June 2017 with the maximum all-time daily count of 2672.
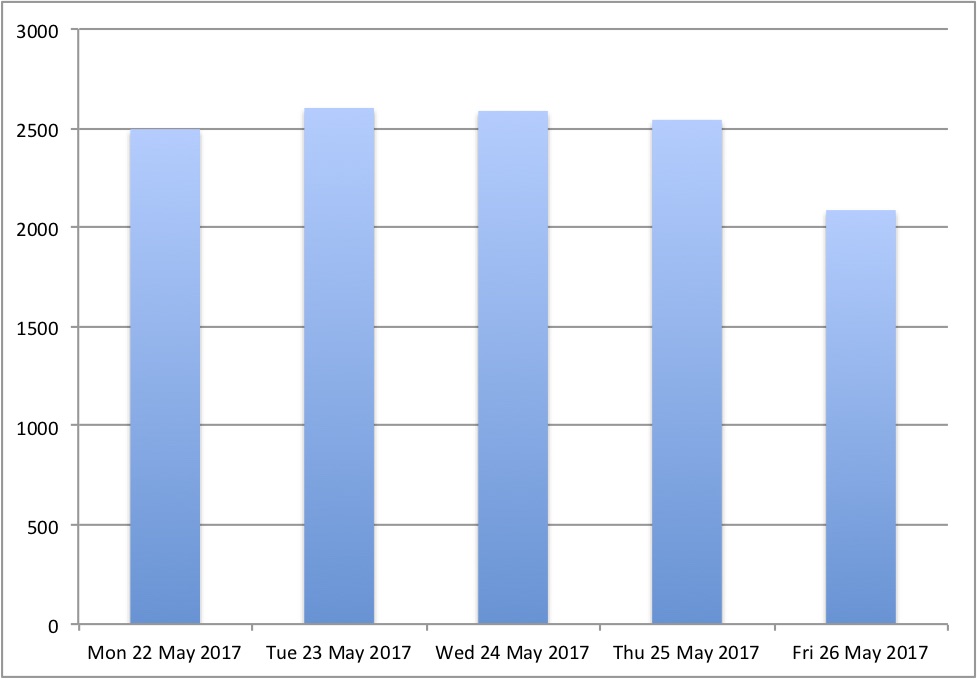
Figure 9 shows the weekdays in the ‘Best week’ (i.e. the one with the highest count). Monday to Thursday averaged 2462 but Friday (as usual) was lower at 2087.
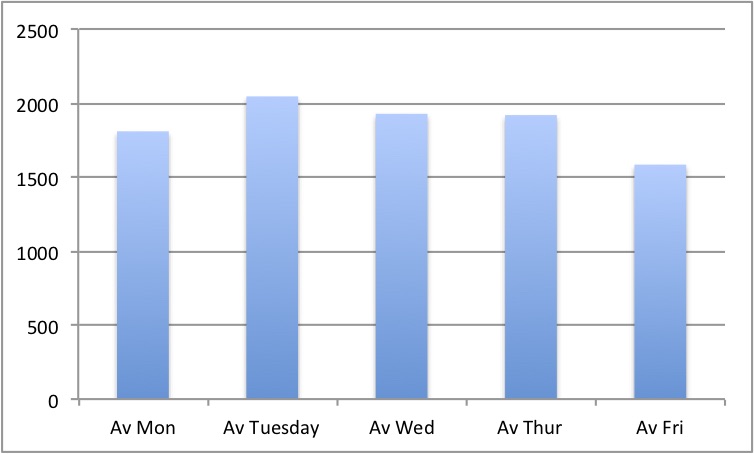
The average weekday count is 1856 but some days are more popular than others. Figure 10 shows the average counts for each weekday. Tuesdays are the most popular, with an average of 2044 journeys. Wednesdays and Thursdays are not far behind. But Friday’s average is only 1583. Maybe people take long weekend breaks, generally starting on Fridays?
Summary
With the four years of data from the first counter in Royal College Street, we have been able to see some trends in the number of cycle journeys. They include the following:
- Relative to the first year, the second year saw about a 5% increase in annual cycle journeys while the third year saw a 22% increase. The fourth year’s count was only marginally greater than the third year’s count.
- The monthly totals show us that the 22% increase started in September 2016, probably as a consequence of the opening of the northern extension in mid-July 2016, and continued until midsummer 2017.
- On inspecting the monthly totals on the Pancras Road counter we were able to confirm that counts from mid-September 2017 to the end of February 2018 were very similar to those in the previous year. That is, the leveling off occurred at both sites.
- On inspecting the daily data, we were able to associate the very low counts in February and March with very cold or very wet weather.
- A comparison of counts from the counter at RCS-N with those from RCS-S showed that the total number of journeys past the northern counter is about 3/4 of the number of journeys past the original counter in Royal College Street, with a slightly higher proportion northbound.
- We noted that this year there are more southbound journeys on Pancras Road than on Royal College Street while northbound journey numbers on Pancras Road are about 75% of those on Royal College Street.
It is regrettable that the Pancras Road counter has been so unreliable and that a great deal of potentially useful data has been lost. It was installed on 22nd September 2015, it had teething troubles during the first year, going out of service from 18th June 2016- 18th September 2016. It was taken down for service between 3rd and 14th March 2017. The data for the period between the 26th February and 21st June 2018 looks so untypical (i.e. not following the same patterns as other data at this site) that we have decided not to include it in our study.
Previous Reports
- Royal College Street Cycle Counter. Summary of first year’s data. On Thu 9 July a record 2627 people used the Royal College Street cycle tracks to avoid the tube strike. 10 July 2015.
- Cycle counts in Royal College Street Comparison of first and second years data from the cycle counter. 24 July 2016.
- Camden’s cycle counters are now open data. Data from cycle counters on Royal College Street and Pancras Road is now open to public access and daily counts have been growing. 4 October 2016.
- More people using Royal College Street. Cycle counters show a substantial increase in numbers since opening of RCS northern extension, 7 Oct 2016
- Weather is cold but they keep on cycling Counts on Royal College St and Pancras Road decrease a little as summer moves to winter. Occasional very heavy rain reduces numbers. 27 Jan 2017.
- A comparison of three years data. Cycle counts in Royal College Street remain high. 7 December 2017

