The cycle counter was installed in Royal College Street in mid-April 2014. Each year, we have reported on the the counts, comparing one year with the next. This report should have appeared in the summer when the third year of data became available. But better late than never! And there is the bonus of another six months of data to inspect.
Royal College Street – annual totals up by over 20%
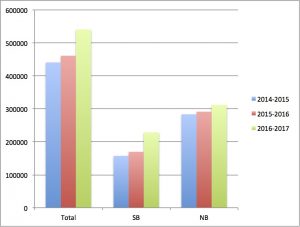
The chart on the left compares the annual counts for the first three years (NB: northbound and SB: southbound). At a first glance we see that the annual total has continued to grow and with a bigger increase in the third year.
For the twelve months from 1st May 2016 to 30th April 2017, the total number of cycles counted was 540,892, compared with 460,995 in the previous twelve months and 440,849 in the twelve months before that. There is an increase of more than 20% when comparing the first and third years.
Once again, the number of northbound cycles exceeds the number of southbound cycles but not by so much as before (down from 63% to 58%). There has been a greater increase in the number of southbound cycles (45%), possibly due to northern extension of the segregated track, providing a new direct route south from Kentish Town.
The total counted from the installation in April 2014 to the end of November 2017 is approaching the second million (1,801,320).
Royal College Street – monthly totals up by 23% from July 2016
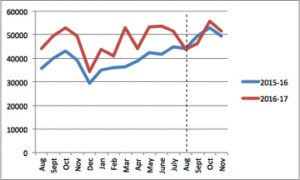
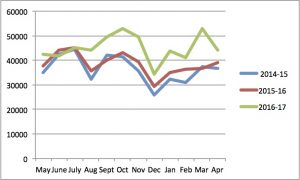
Royal College Street monthly counts Aug 2015-Nov 2016 compared with Aug 2016-Nov 2017. Click to enlarge.
The chart on the left compares monthly counts for the first three years. The green line represents the period 1st May 2016 – 30th April 2017. The counts from July 2016 on shows a considerable increase in numbers over the previous 12 months (on average a 23% increase).
In October 2016 we noted that More people are using Royal College Street since the northern extension was opened in mid July 2016. The chart on the right shows that this increase was maintained during the whole of the first year it was in place. The dashed line on the chart shows where the year is completed; after that, the counts for last year and this year are similar.
Royal College Street – weekly data show peaks of up to 13 thousand cycles
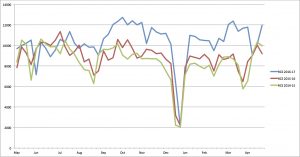
The chart on the left compares counts over the entire week including weekends. From September 2016 on, the weekly totals were over 10,000 with the exception of a big dip during the Christmas-New Year period, a smaller dip around Easter and another in the second week of February. The largest weekly total was 12,730 and in 9 different weeks, the total was over 12,000 cycles.
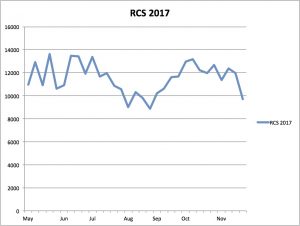
The chart on the right shows the weekly counts from May to November 2017. They continue to be high, with a maximum of 13610 in the third week of May. In five weeks, the counts were over 13,000 and in five more weeks they were over 12,000.
Royal College Street –1st May 2016 – 30th November 2017. Weekday counts regularly exceed 2000 cycles
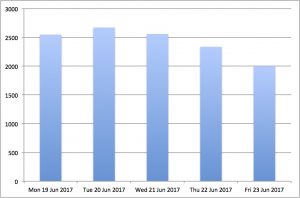
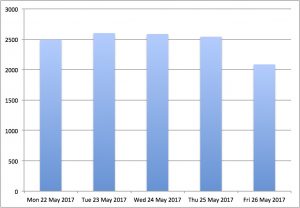
This website displays yesterday’s counts on the Home page. This year we kept on noticing that the weekday counts were regularly exceeding 2000. In fact this occurred on 138 weekdays in 2017 – and on 78 of those days, the count was over 2200.
Tuesday 20th June saw the maximum all time daily count of 2672. The chart on the left shows the counts for each day that week (Monday 19th June – Friday 23 June) in which even the Friday reached 2000. Our previous maximum daily total of 2627 was on Thursday 9th July 2015 the day of a tube strike.
The chart on the right shows the counts for another glorious week (Monday 22nd May – Friday 26th May) with every day except Friday having counts over 2500.
Counter in Pancras Road– a counter that fails from time to time.
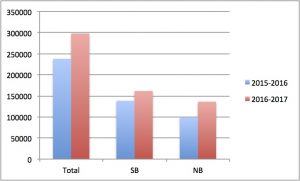
Pancras Road: comparison of 1st Oct 2015 –31 May 2016 with 1st Oct 2016 –31 May 2017 – omitting March. Click to enlarge
The Pancras Road cycle counter was installed on 22nd September 2015, it had teething troubles during the first year, going out of service from 18th June 2016- 18th September 2016. It was taken down for service between 3rd and 14th March 2017. The nearest we can get to making a comparison of the last two years is to compare the two sets of months October to May omitting March.
The chart on the left compares the annual counts 2015-15 and 2016-17 (NB: northbound and SB: southbound). For the seven available months (Oct–Feb and Apr–May), the total number of cycles counted was 298,078 compared with 237,975 in the previous year. These figures shows a 25% increase from the year 2015-16 to the year 2016-17.
The southbound share on Pancras Road is greater than on Royal College Street, as many people join this route via St Pancras Way. But over the two years, it fell slightly from 58% to 54%, due to a greater increase in the number of northbound cycles of 37% vs 17%.
Monthly counts in Pancras Road

Pancras Road: monthly data 1st October 2015 to 31st May 2016 compared with 1st October 2016 to 31st May 2017 (March omitted). Click to enlarge.
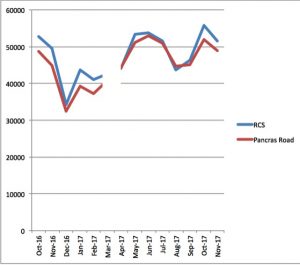
Comparison of monthly counts on Royal College Street and Pancras Road (figures for March omitted). Click to enlarge.
The chart on the left shows a comparison between 2015-16 and 2016-17 for the seven available months (Oct–Feb and Apr–May). The average increase is almost 25% when comparing the two years.
The chart on the right shows a comparison between counts on Pancras Road and on Royal College Street from October 2016 – November 2017, omitting March. They are surprisingly similar considering that many people on Royal College Street still use the Somerstown route.
Other counts on Pancras Road
With all the gaps in the data, there is not much motivation to look in depth at the weekly and daily counts. But we have identified a maximum all time daily count of 2563 on Tuesday 20th Jun 2017. We also note that in the period 1st May – 30th November 2017 the weekday counts were regularly exceeding 2000. In fact this occurred on 66 weekdays – and on 24 of those days, the count was over 2200 and seven over 2400.
Previous Posts about the cycle counters
Cycle Counter in Royal College Street Usage increased with the new tracks, so Camden Council have installed a cycle counter; post-implementation improvements and news about the northern and southern extensions. 20th April 2014
Royal College Street Cycle Counter. Summary of first year’s data. On Thu 9 July a record 2627 people used the Royal College Street cycle tracks to avoid the tube strike. 10 July 2015
Cycle counts in Royal College Street Comparison of first and second years data from the cycle counter, 24 July 2016
Camden’s cycle counters are now open data. Data from cycle counters on Royal College Street and Pancras Road is now open to public access and daily counts have been growing.
More people using Royal College Street. Cycle counters show a substantial increase in numbers since opening of RCS northern extension, 7 Oct 2016
Weather is cold but they keep on cycling Counts on Royal College St and Pancras Road decrease a little as summer moves to winter. Occasional very heavy rain reduces numbers. 27 Jan 2016.

